Monitoring environmental change with photopoints at Walker Swamp – what has changed in the four years since restoration commenced?
Walker Swamp is a large and complex wetland system, that NGT originally purchased in 2018 for restoration (read more about our initial restoration works here).
Understanding how large wetland systems like Walker Swamp respond to restored cycles of inundation (flooding) over time and space, requires a complex and expensive monitoring program. To address this challenge, NGT implemented a comprehensive monitoring program (Kerr et al. 2020) to define what we call our baseline condition – that is, the biodiversity present when the project began. After that, we undertook annual limited surveys of particular fauna and flora that would indicate how the wetland was recovering, with the plan of repeating the aforementioned more comprehensive surveys every decade.
Monitoring change in vegetation communities presents a particular challenge. The usual method is time consuming (and hence expensive) as it involves counting and identifying plants over predefined areas of representative ground (often quadrats or line transects), repeated a number of times. However, a relatively cheap and simple alternative method of documenting ecological restoration and management outcomes is to use photopoints. To enable monitoring of long-term changes in vegetation, vista and wetland extent and condition, a series of baseline photographs were taken across the Walker Swamp Restoration Reserve (WSRR) in 2019.
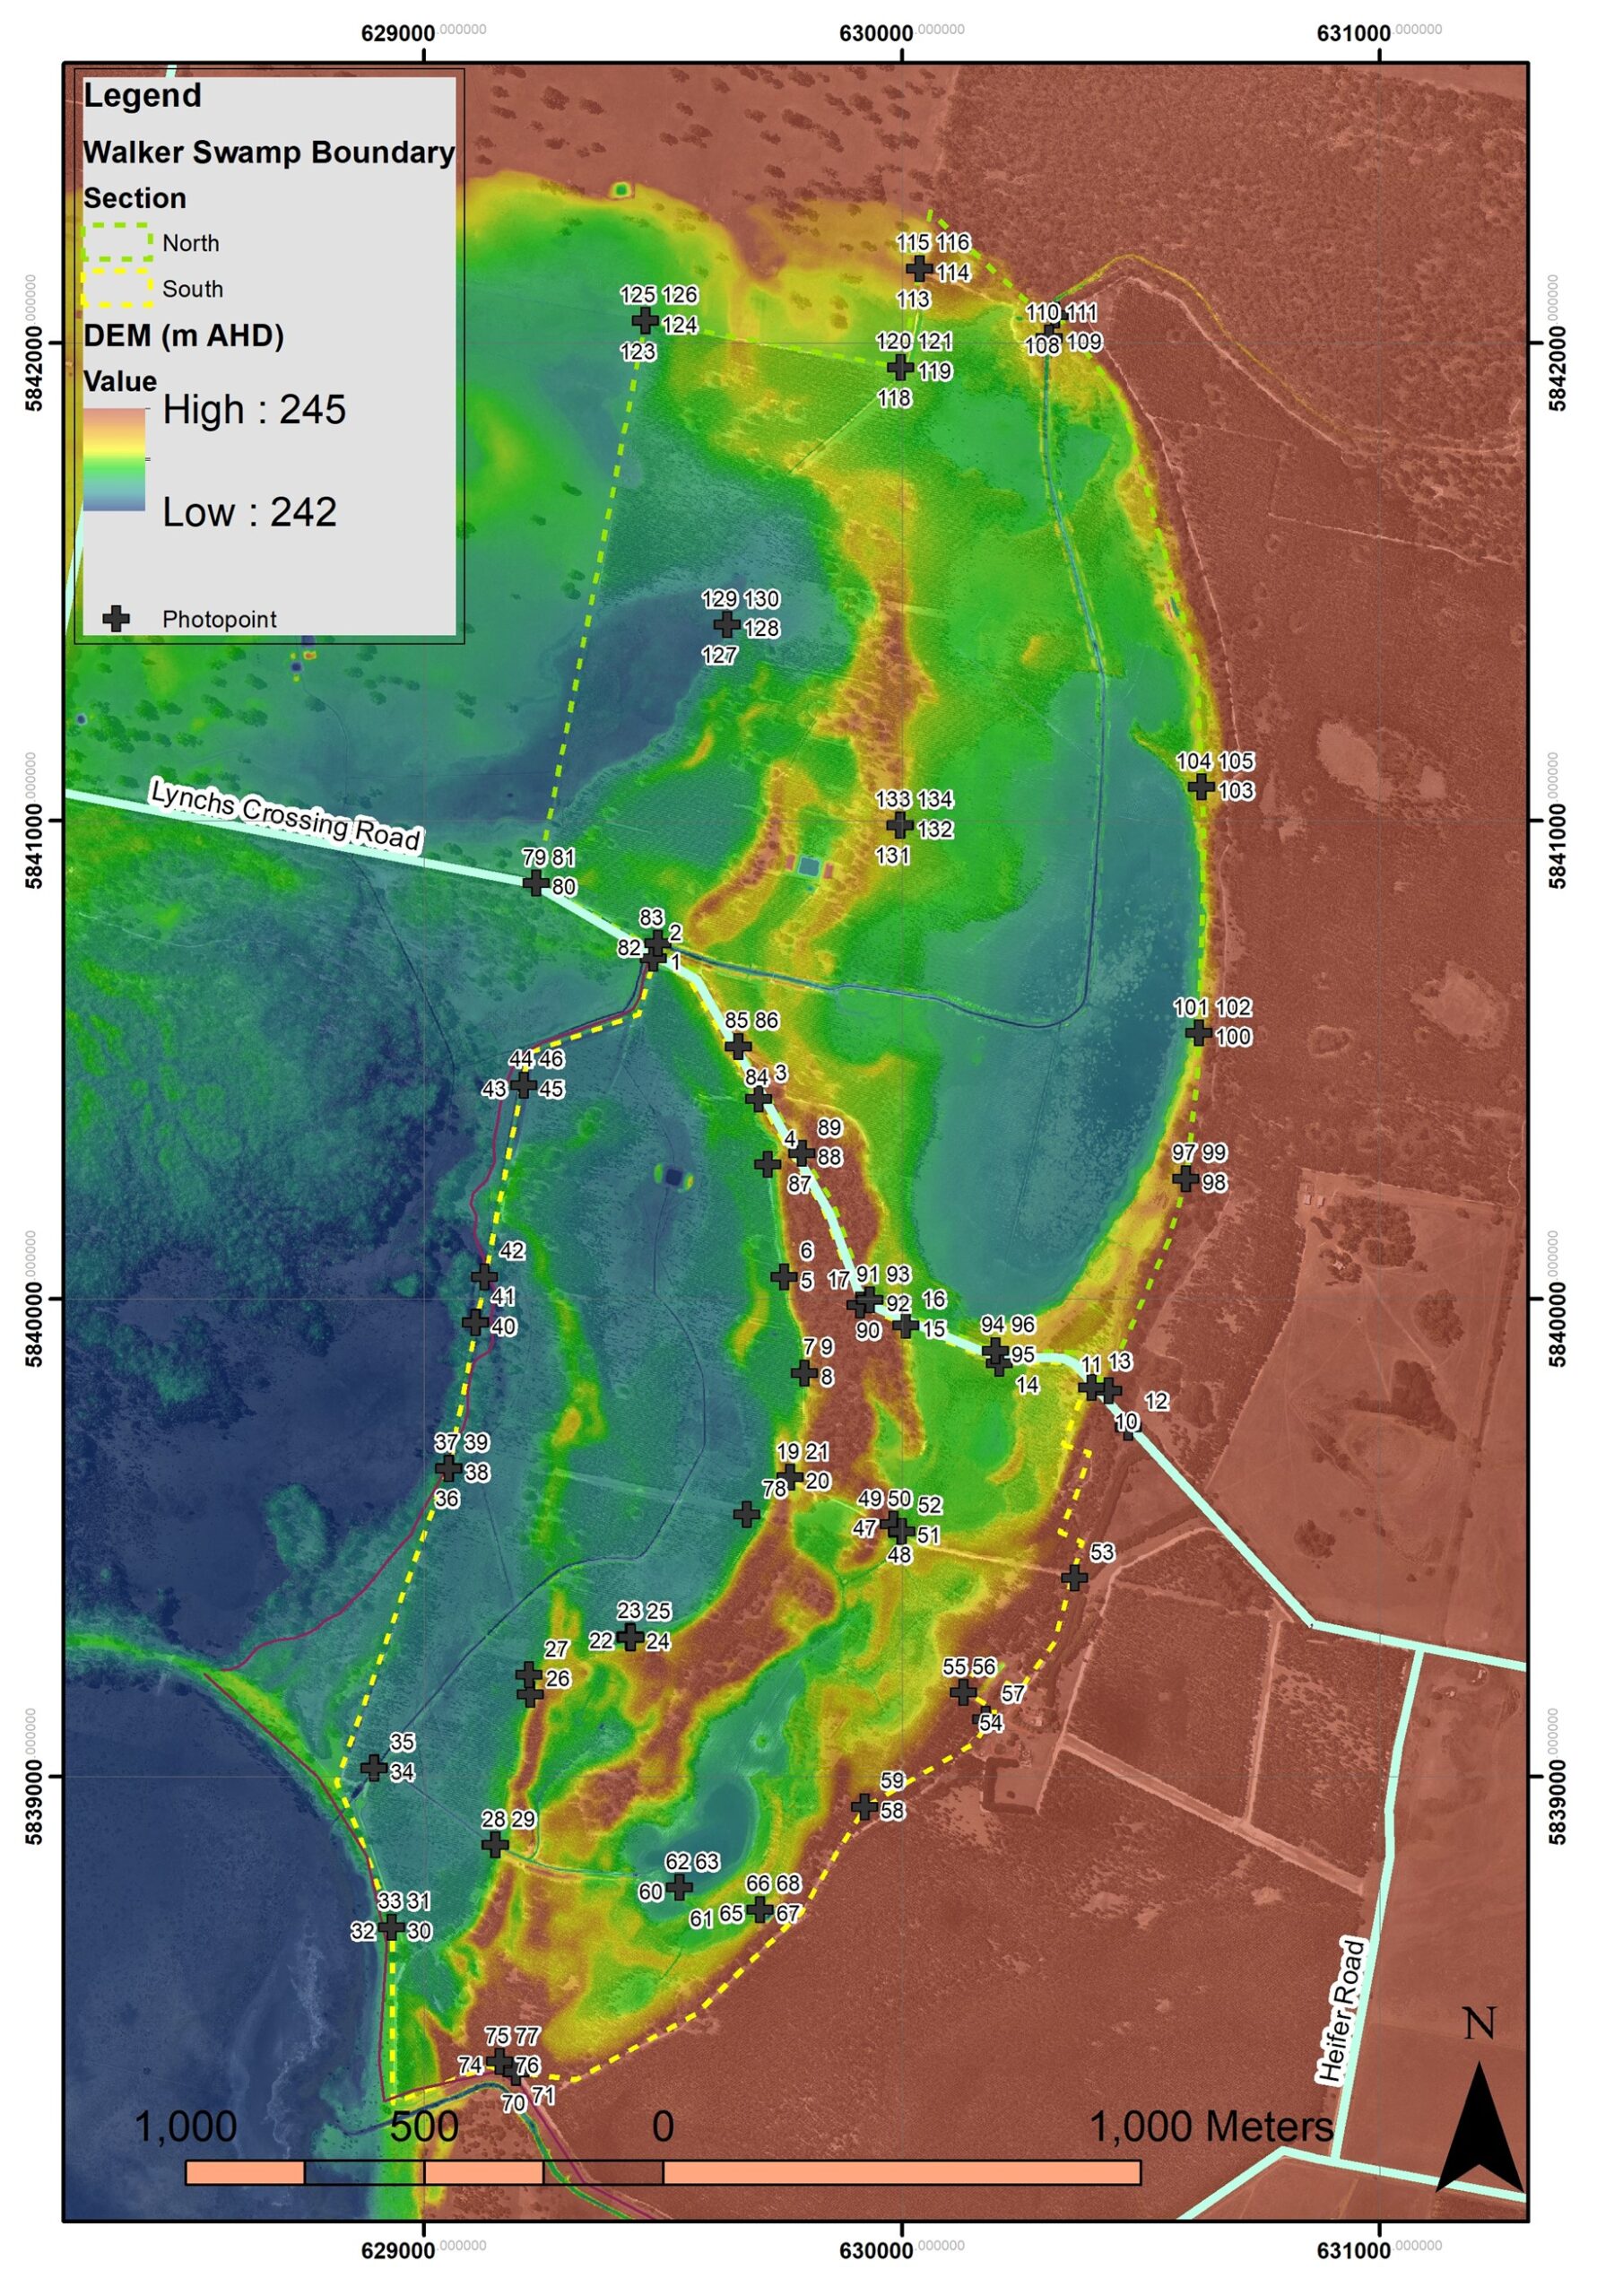
A total of 134 reference photos were established in January 2019 across the WSRR – 75 in the southern section of WSRR (south of Lynchs Crossing Rd) and 59 in the northern section (Figure 1).
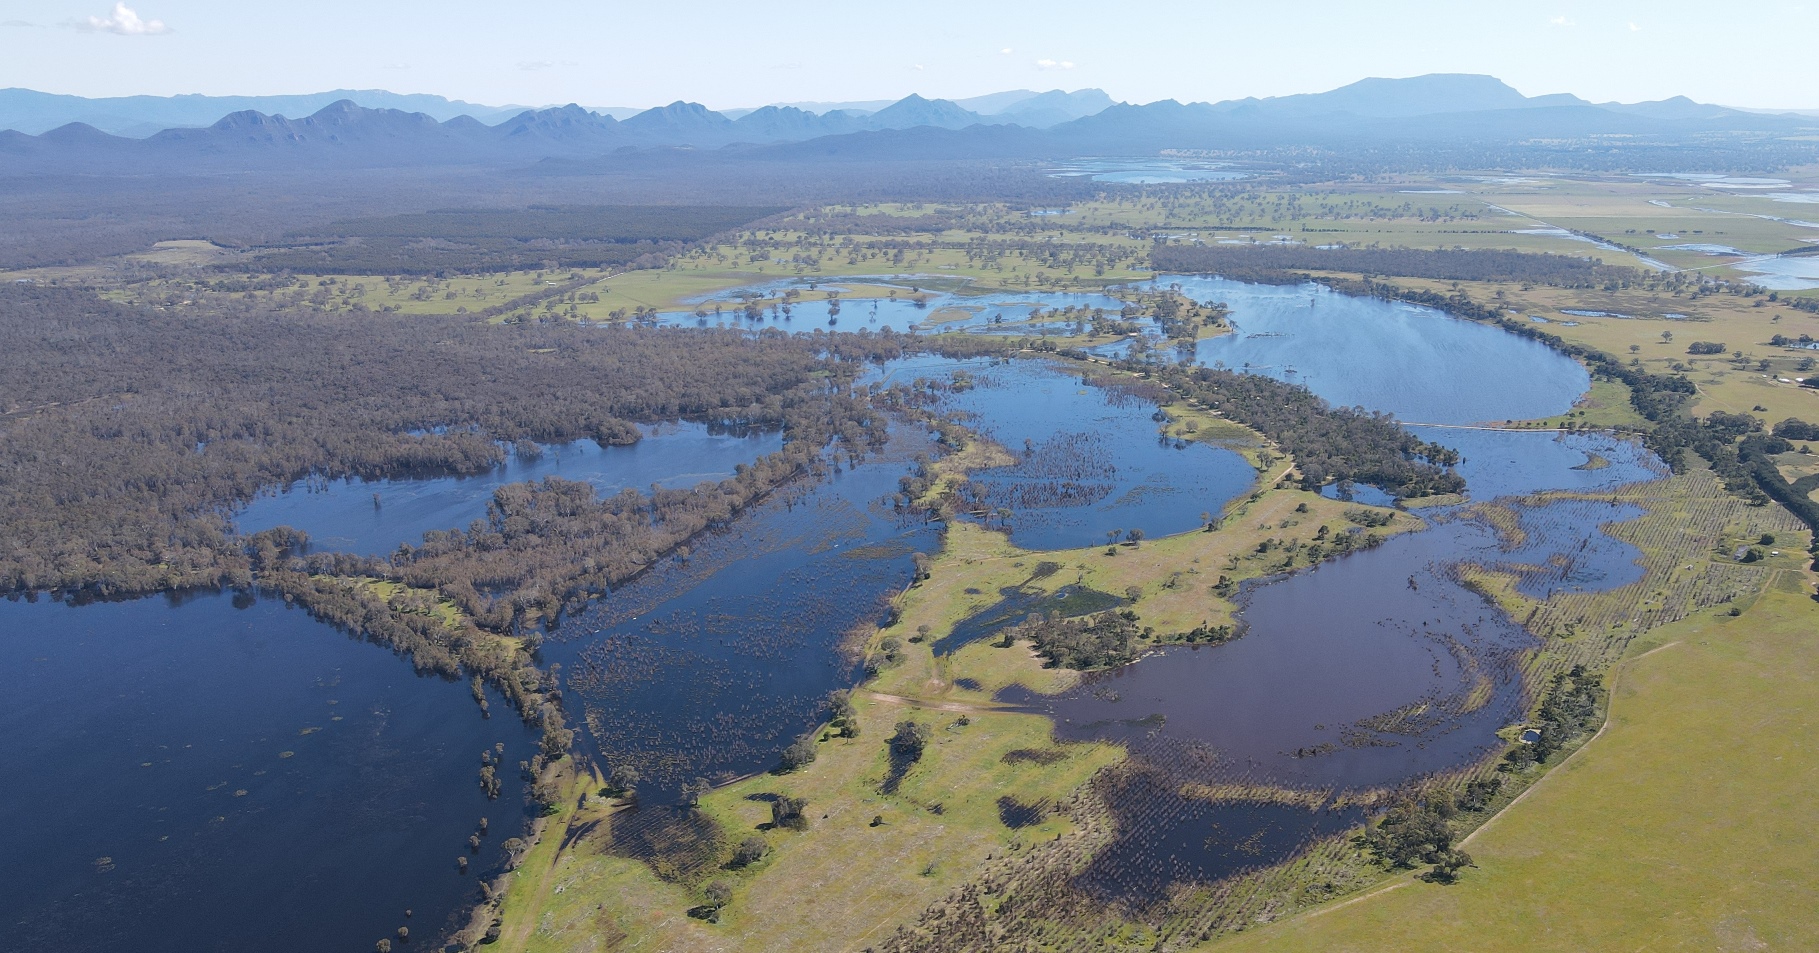
We took photographs again in November 2022 after Walker Swamp experienced its first major flood event post-restoration. Very high inflow levels meant that the wetland surcharged to around 120% of its normal full supply level (Figure 2). This was actually the third year of inundation at the new full supply level following the restoration of the wetland complex in 2019 and its first filling event in 2020. The photopoints were again repeated in April 2023 to gauge the response of the wetland vegetation to the surcharged (over usual capacity) inundation level across the landscape.
Photopoint monitoring can also be a useful method of monitoring change in such things as:
- landscape level transitions,
- the presence or absence of a plant species/group of species, or vegetation layer,
- plant growth,
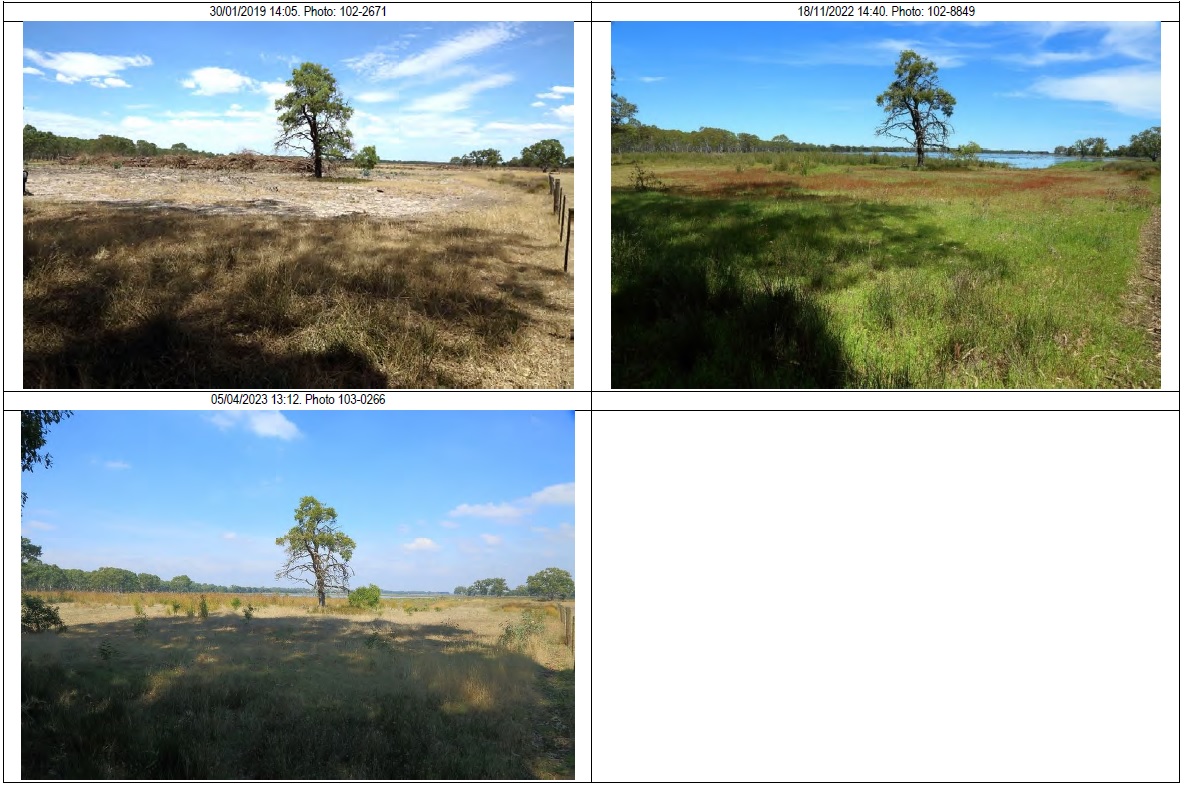
- extent of cover and survivorship (Figure 3, below),
- changes in age class and life stages,
- changes in density and
- the impact of grazing (O’Connor and Bond 2007).
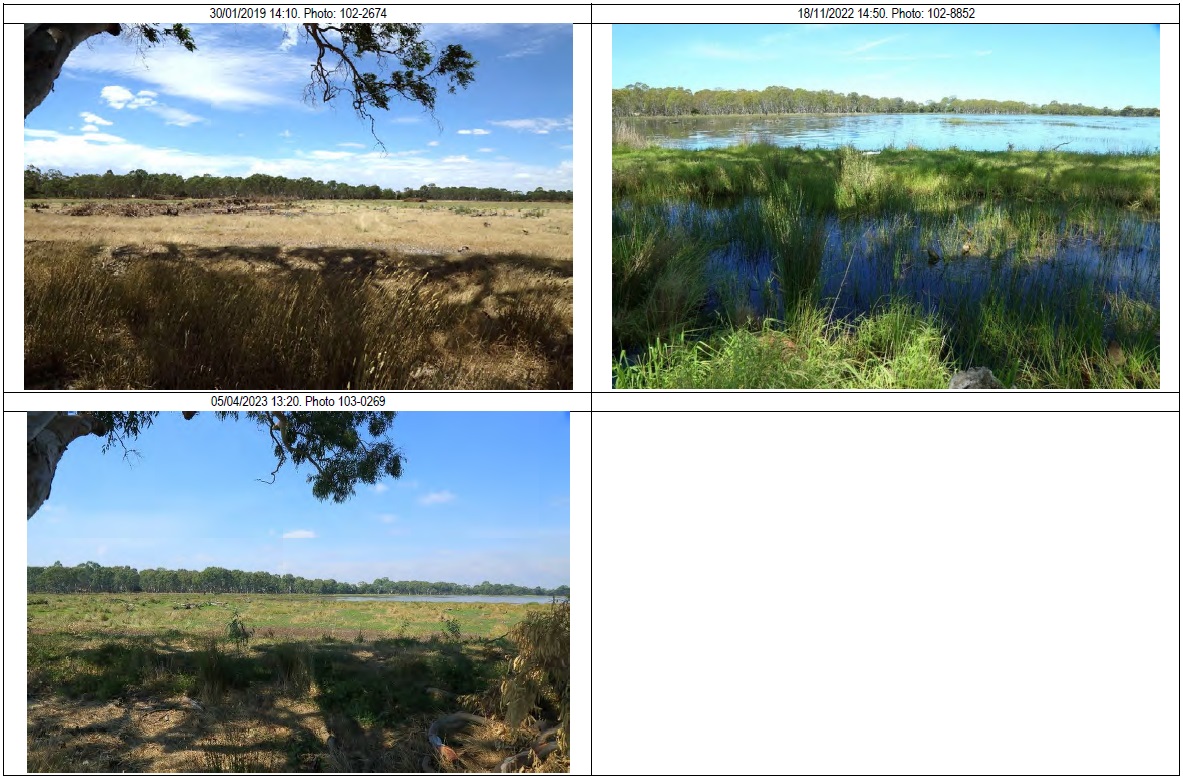
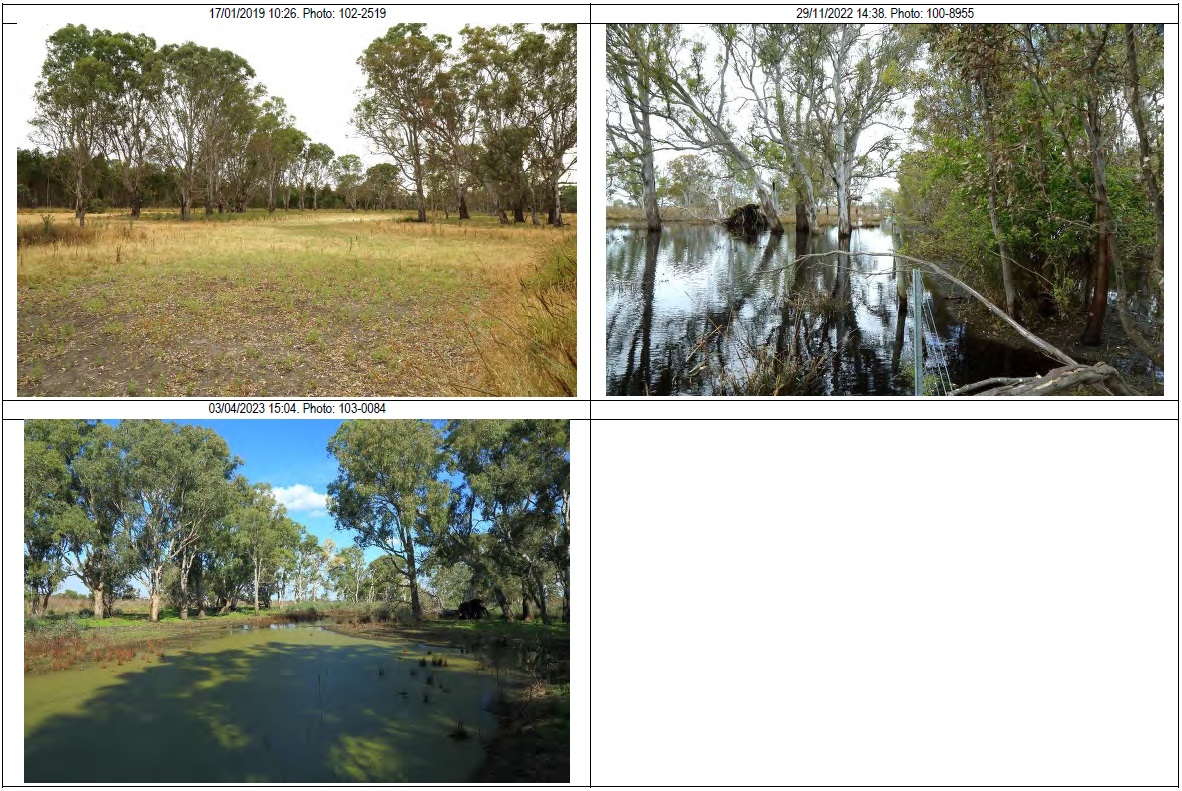
A grid of photopoints with sites spaced across the entire project area provides a range of different perspectives, compared to photographs taken at noteworthy sites identified at the start of the project. The placement of many sites dispersed across the reserve is providing a record of unexpected changes at many locations, both in the area affected by the restored water levels (Figure 4), and in more terrestrial areas. With this in mind, it is apparent that both a grid-style approach, and the placement of photopoints at key sites where change is anticipated, are important in better understanding and documenting the changes that arise from a change to land management.
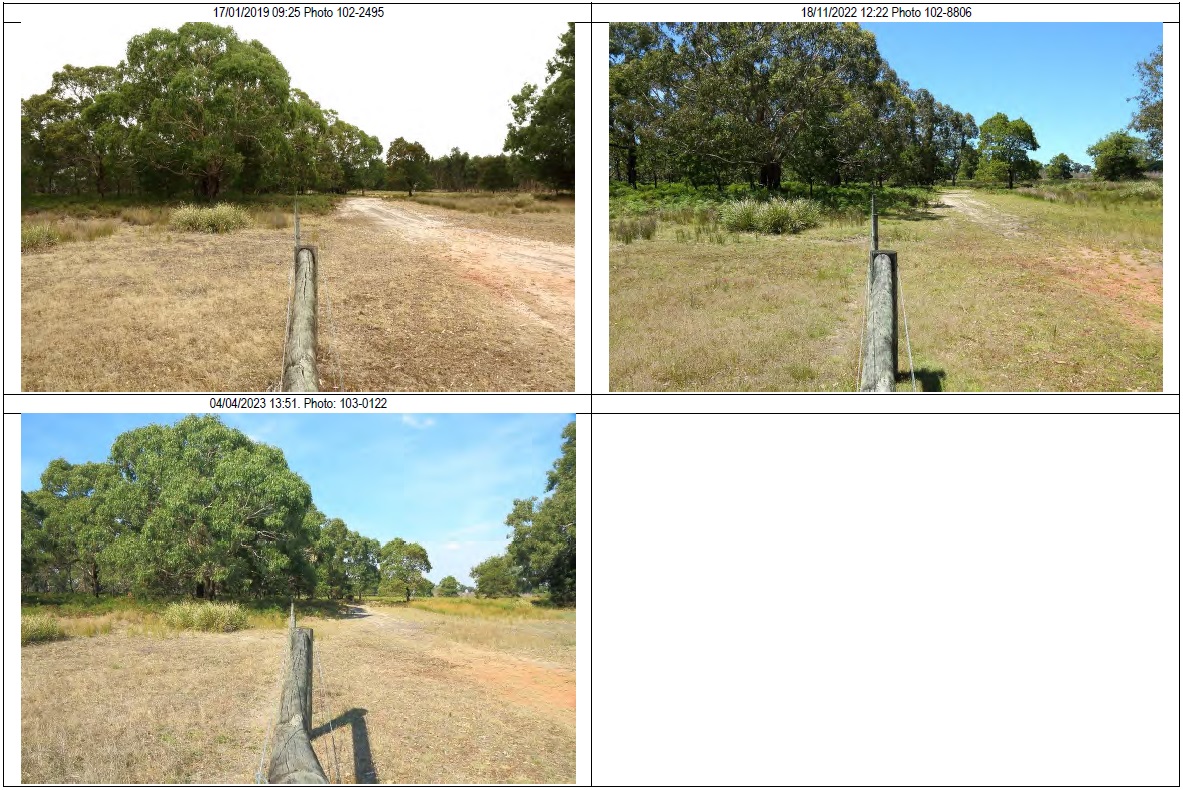
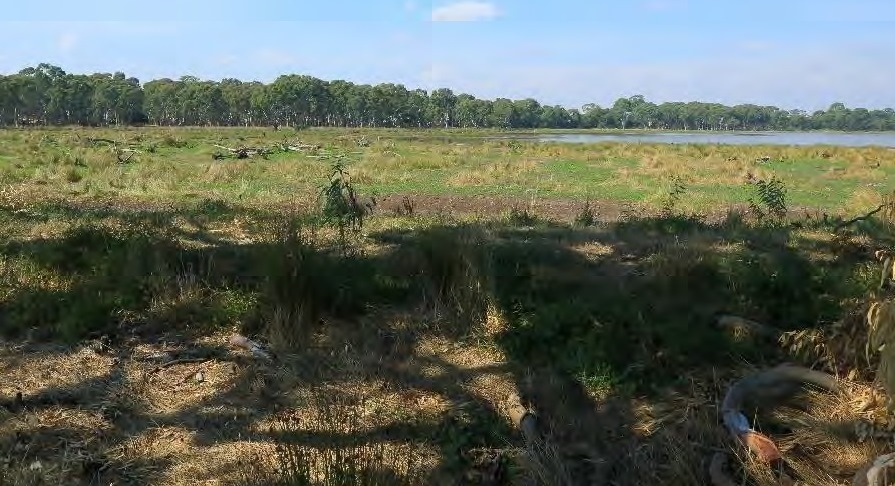
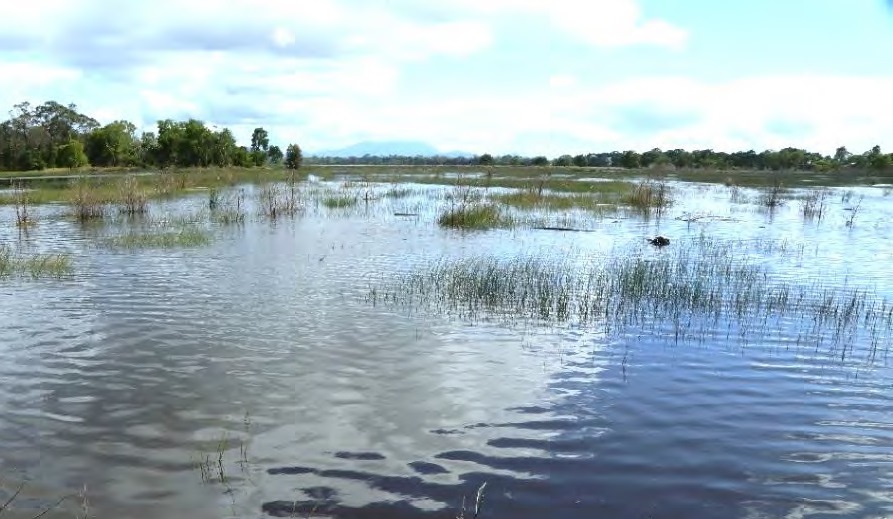
The photopoints show, after only three years, marked changes at some sites. For example photopoints 52 (Figure 5) and 64 (Figure 6), with plantation blue gums cleared and wetland formation producing marked changes to vegetation and allowing spectacular vistas to re-appear.


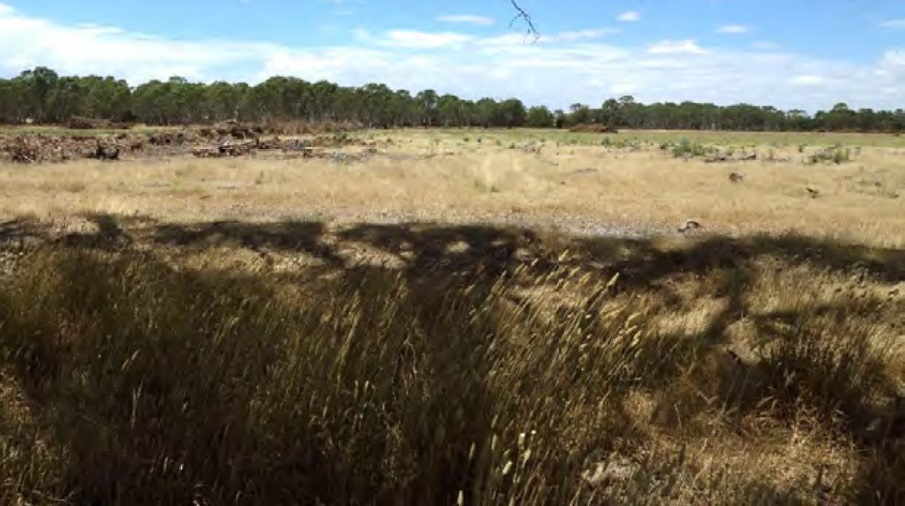
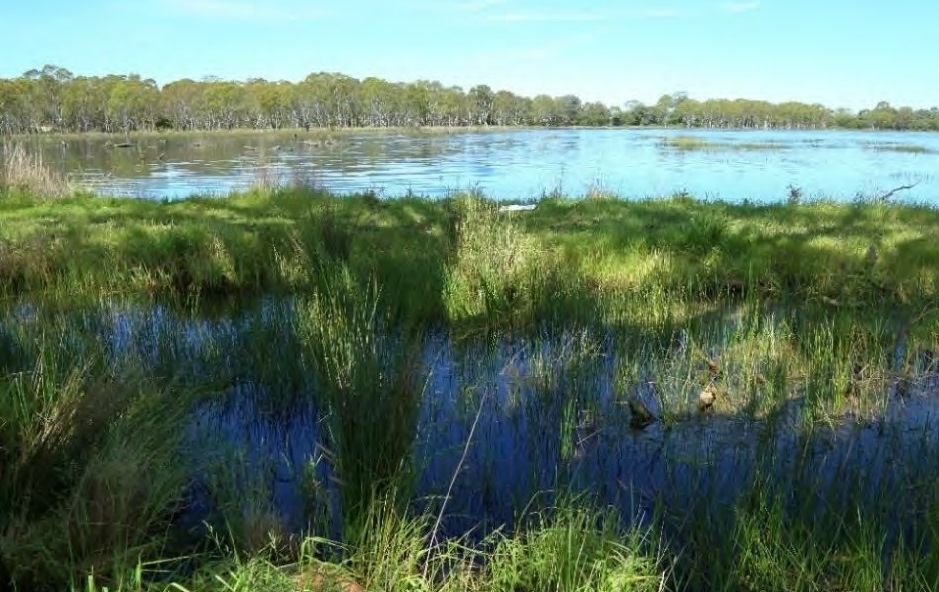
While other sites have remained relatively unchanged, for example in photopoint 18 (Figure 7) below.
In assembling this collection of reference photographs, we learned a few key things to improve the quality of this kind of data in the future. What we initially thought were subtle differences in camera location, direction and elevation of photographs at the same site over time, turned out to be quite important for the quality of data.
We’d like to share some key things we found (in hope of avoiding pitfalls in the future):
- Use of the same camera, lens and focal length are critical to achieving an effective outcome. Perhaps the most important is accidental changes to the focal length, e.g., Site 42 (Figure 8).
- Centring of the picture:
- Vertical (e.g., photopoint 119; Figure 4).
- Where large trees are present in the view, centre the horizon in the middle of the picture
- Where the vegetation presents a low profile, centre the horizon 1/3rd of the distance from the top of the picture
- Horizontal
- Even with the relatively wide field of view captured by a 24 mm lens, very small differences in the angle of orientation of the photograph (e.g., photopoint 52; Figure 5), or the location an direction of the camera (e.g., photopoint 42) miss significant components of vegetation on the edges of the photograph
- Cues to avoid this outcome include:
• Orienting along a defined structure e.g., a fence line or post
• Orienting towards a defined object e.g., a mountain peak or tree on the horizon
• Orienting perpendicular to a linear object such as a fence
• Placing the camera on a defined object or point such as a fence post
- Vertical (e.g., photopoint 119; Figure 4).
As a result of changed land management practices, marked changes in vegetation and or inundation can make it difficult to locate the original location for the camera and / or correct camera orientation.
Finally, despite it sometimes being difficult to perfectly replicate the original view, there is also the option to make good use of the information that is available, by cropping to better match up the position of the skyline and more of the key features in multiple images, helping to partially overcome some of the issues referred to above. To see how this method can be used to greatly improve the quality of the photopoint comparison over time, please see examples taken from Figures 4 and 5 above, after cropping and re-displayed below in Figures 9 and 10 respectively.


References
Kerr G. D. (2023). Walker Swamp Restoration Reserve Photopoints. April 2023. Nature Glenelg Trust, Hamilton, Victoria.
Kerr, G. D., Peters, M., Farrington, L., & Bachmann, M. (2020). Walker Swamp Restoration Reserve Monitoring Plan March 2020. Hamilton, Victoria.
O’Connor, P. J., & Bond, A. J. (2007). Maximizing the effectiveness of photopoint monitoring for ecological management and restoration. Ecological Management & Restoration, 8(3), 228-234.
This project is supported by the following project partners: