The early vote is in – the birds like the Walker Swamp renovations (and they’ve been telling their friends)
After six years of intensive monitoring at Walker Swamp Restoration Reserve (WSRR) and following completion of the major on ground works, the initial response of the avian community to these changes can now be gauged. Digging into the results from 115 bird surveys including 46 x 20-minute (2ha) surveys; 42 x area search (500 m radius) surveys; 14 x Shorebird 2020 counts; three x 5 km radius area search surveys, and ten incidental searches, show a total of 129 species recorded in association with all habitats at WSRR.
Changes to the wetland were designed to increase the area of inundation and extend the period of inundation without removing the important wet / dry cycles that underpin wetland productivity. The changes meant that there was an increased likelihood of some wetlands in the Reserve holding water through summer into early autumn, providing important summer (and potentially drought) refuge for a range of water-dependent species. And indeed, in some years the wetlands might now stay wet all year.
With increased depth of water, the wetlands remaining wet for longer, and wetting and drying over a larger area, the types and distribution of plant communities present was also expected to increase. The plants that grow in the areas that dry out over summer and autumn are the main source of energy and carbon for the wetland when it fills in the next winter. Bacteria and fungi break down these plants when the wetland floods and the rest of the food web builds upon this. So the variety of food and shelter mean a wider diversity of animals that need wetlands are attracted to and able to live in the swamp. The more reliable and longer lasting water also increases the likelihood that a greater number of species, including colonial nesting waterbirds (like ibis and spoonbills), may start to breed across the Reserve. Most waterbirds are found feeding in water around the edge in depths up to about 30 cm. Because the wetlands now include a large area of shallow gently graded edge, the inundated shallow mud flat and sand flat areas should increase both the productivity and carrying capacity of the wetlands. A range of diving birds (e.g. hardhead ducks, grebes, blue-billed ducks and musk duck) may use the deeper water habitat.
The question is what did the waterbirds think of these ideas?
Over the past 18 years there have been 48 surveys of waterbirds at Walker Swamp and 53 wetland dependent bird species have been recorded across all the wetlands.
To see if the survey effort at Walker Swamp has been adequate to describe the waterbirds a species accumulation curve (SAC; or species-richness curves, collector’s curves, species effort curves) was plotted (Figure 2). These graphs are used to estimate the adequacy of a fauna survey (in this case, the number of waterbird species) in representing the fauna in a particular area. When you start surveying a new area most of the birds you see are new observations and so the curve increases steeply. As you continue to monitor the number of new species drops off and the curve flattens out. If all the species in an area have been recorded then the SAC will become a horizontal line. At Walker Swamp the curve reveals that new waterbird species were still being added when sampling stopped (as of the last survey on 26/02/2020) and that the asymptote had not been reached. This is despite the relatively high sample intensity.

This is great, as the curve shows an ongoing increase in new waterbird species being recorded. This indicates that the recent changes to increase the duration, extent and timing of inundation in the wetland are allowing new species to settle. So we are still getting new species arriving as they discover Walker Swamp and find the appropriate habitat niche there.
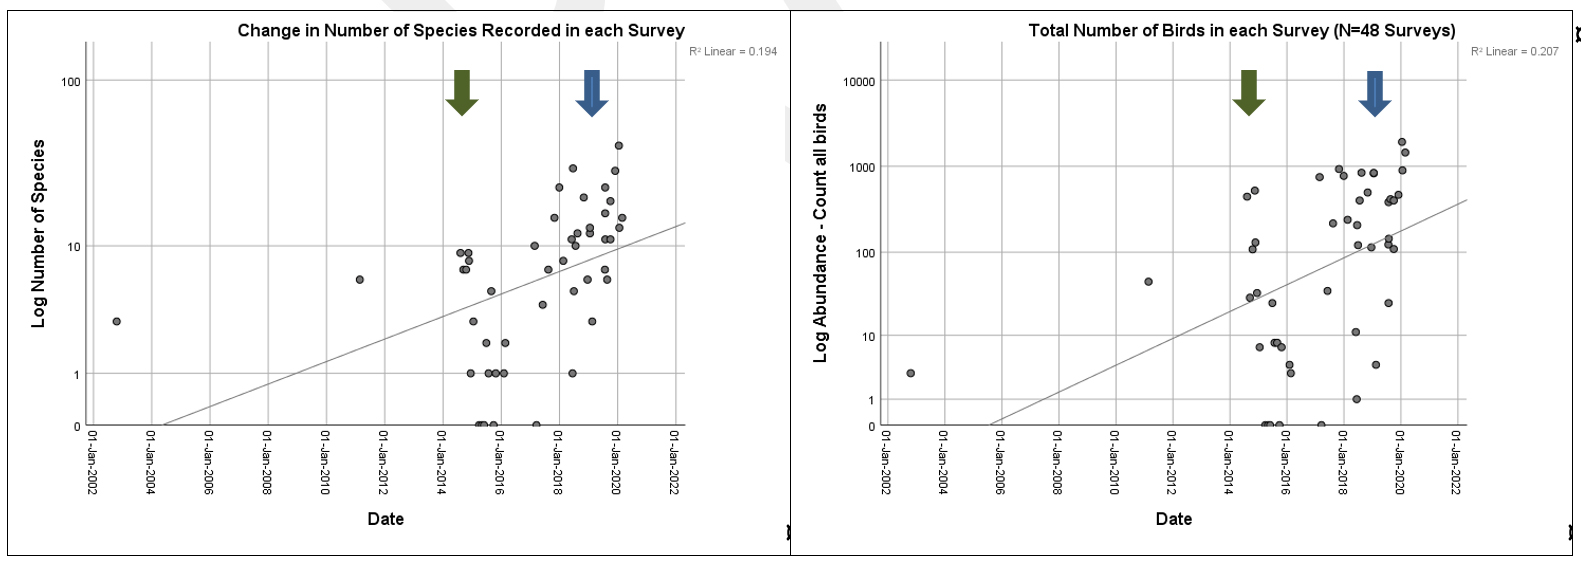
While the number of waterbirds recorded in each survey varies a lot every year as birds come and go with the wetting and drying of the wetland, on average both the number of waterbird species (Figure 3A) and their abundance (Figure 3B) have increased throughout the time of monitoring.
Of the 53 species, 11 species (20.7%) are singletons (i.e. recorded in only one survey: Freckled Duck, Banded Stilt, Red-necked Avocet, Red-capped Plover, Black-fronted Dotterel, Wood Sandpiper, Australian Pelican, Nankeen Night-Heron, White-bellied Sea-eagle, Little Eagle and Australian Reed-Warbler). These are species we expect to see more of as the complexity of habitat and the food web in the wetland increases. Four species (7.5%) are doubletons (Pink-eared Duck, Musk Duck, White-throated Needletail and Royal Spoonbill), again species we hope to record more frequently into the future. The most often recorded species in Walker Swamp were: Black-winged Stilt, Pacific Black Duck, Grey Teal, Black Swan, White-faced Heron, Australian Shelduck and Masked Lapwing. Species like the migratory Sharp-tailed Sandpiper (Figure 4) have recently been recorded in flocks of up to 500 birds. They can be seen in summer foraging in the shallow water and mudflats in the north western region of Walker Swamp.

The impact of the restoration works can also be seen by comparing the mean number of species in association with each of the major works (Figure 5). Firstly, following the construction of a temporary regulator (Sill 242.90 m AHD) in August 2014 and then after construction of the permanent regulator in March 2019 at a higher sill height (243.5 m AHD). Increasing the area that is wet and the time it is wet for through the installation of a permanent regulator has been an important part of restoring more natural wetting and drying patterns.
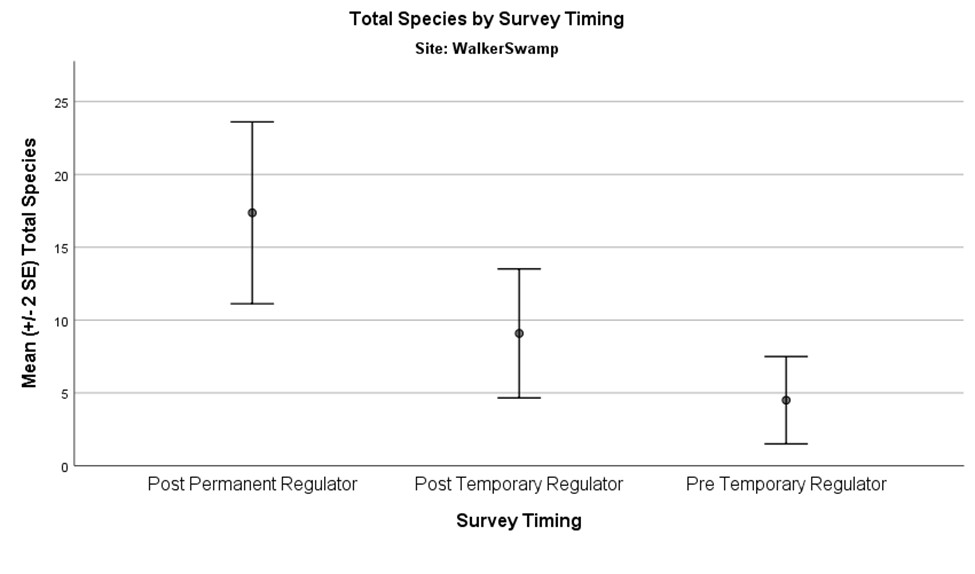
An important foraging guild to appear more often and in greater abundance in the wetland post regulator construction has been the diving ducks and grebes. This includes Hardheads, Musk Duck, Blue-billed Duck, Pink-eared Duck and Freckled Duck and both the Australasian and Hoary-headed Grebes. This indicates an increase in abundance and diversity of aquatic infauna, as shown by invertebrate survey results at the Reserve.
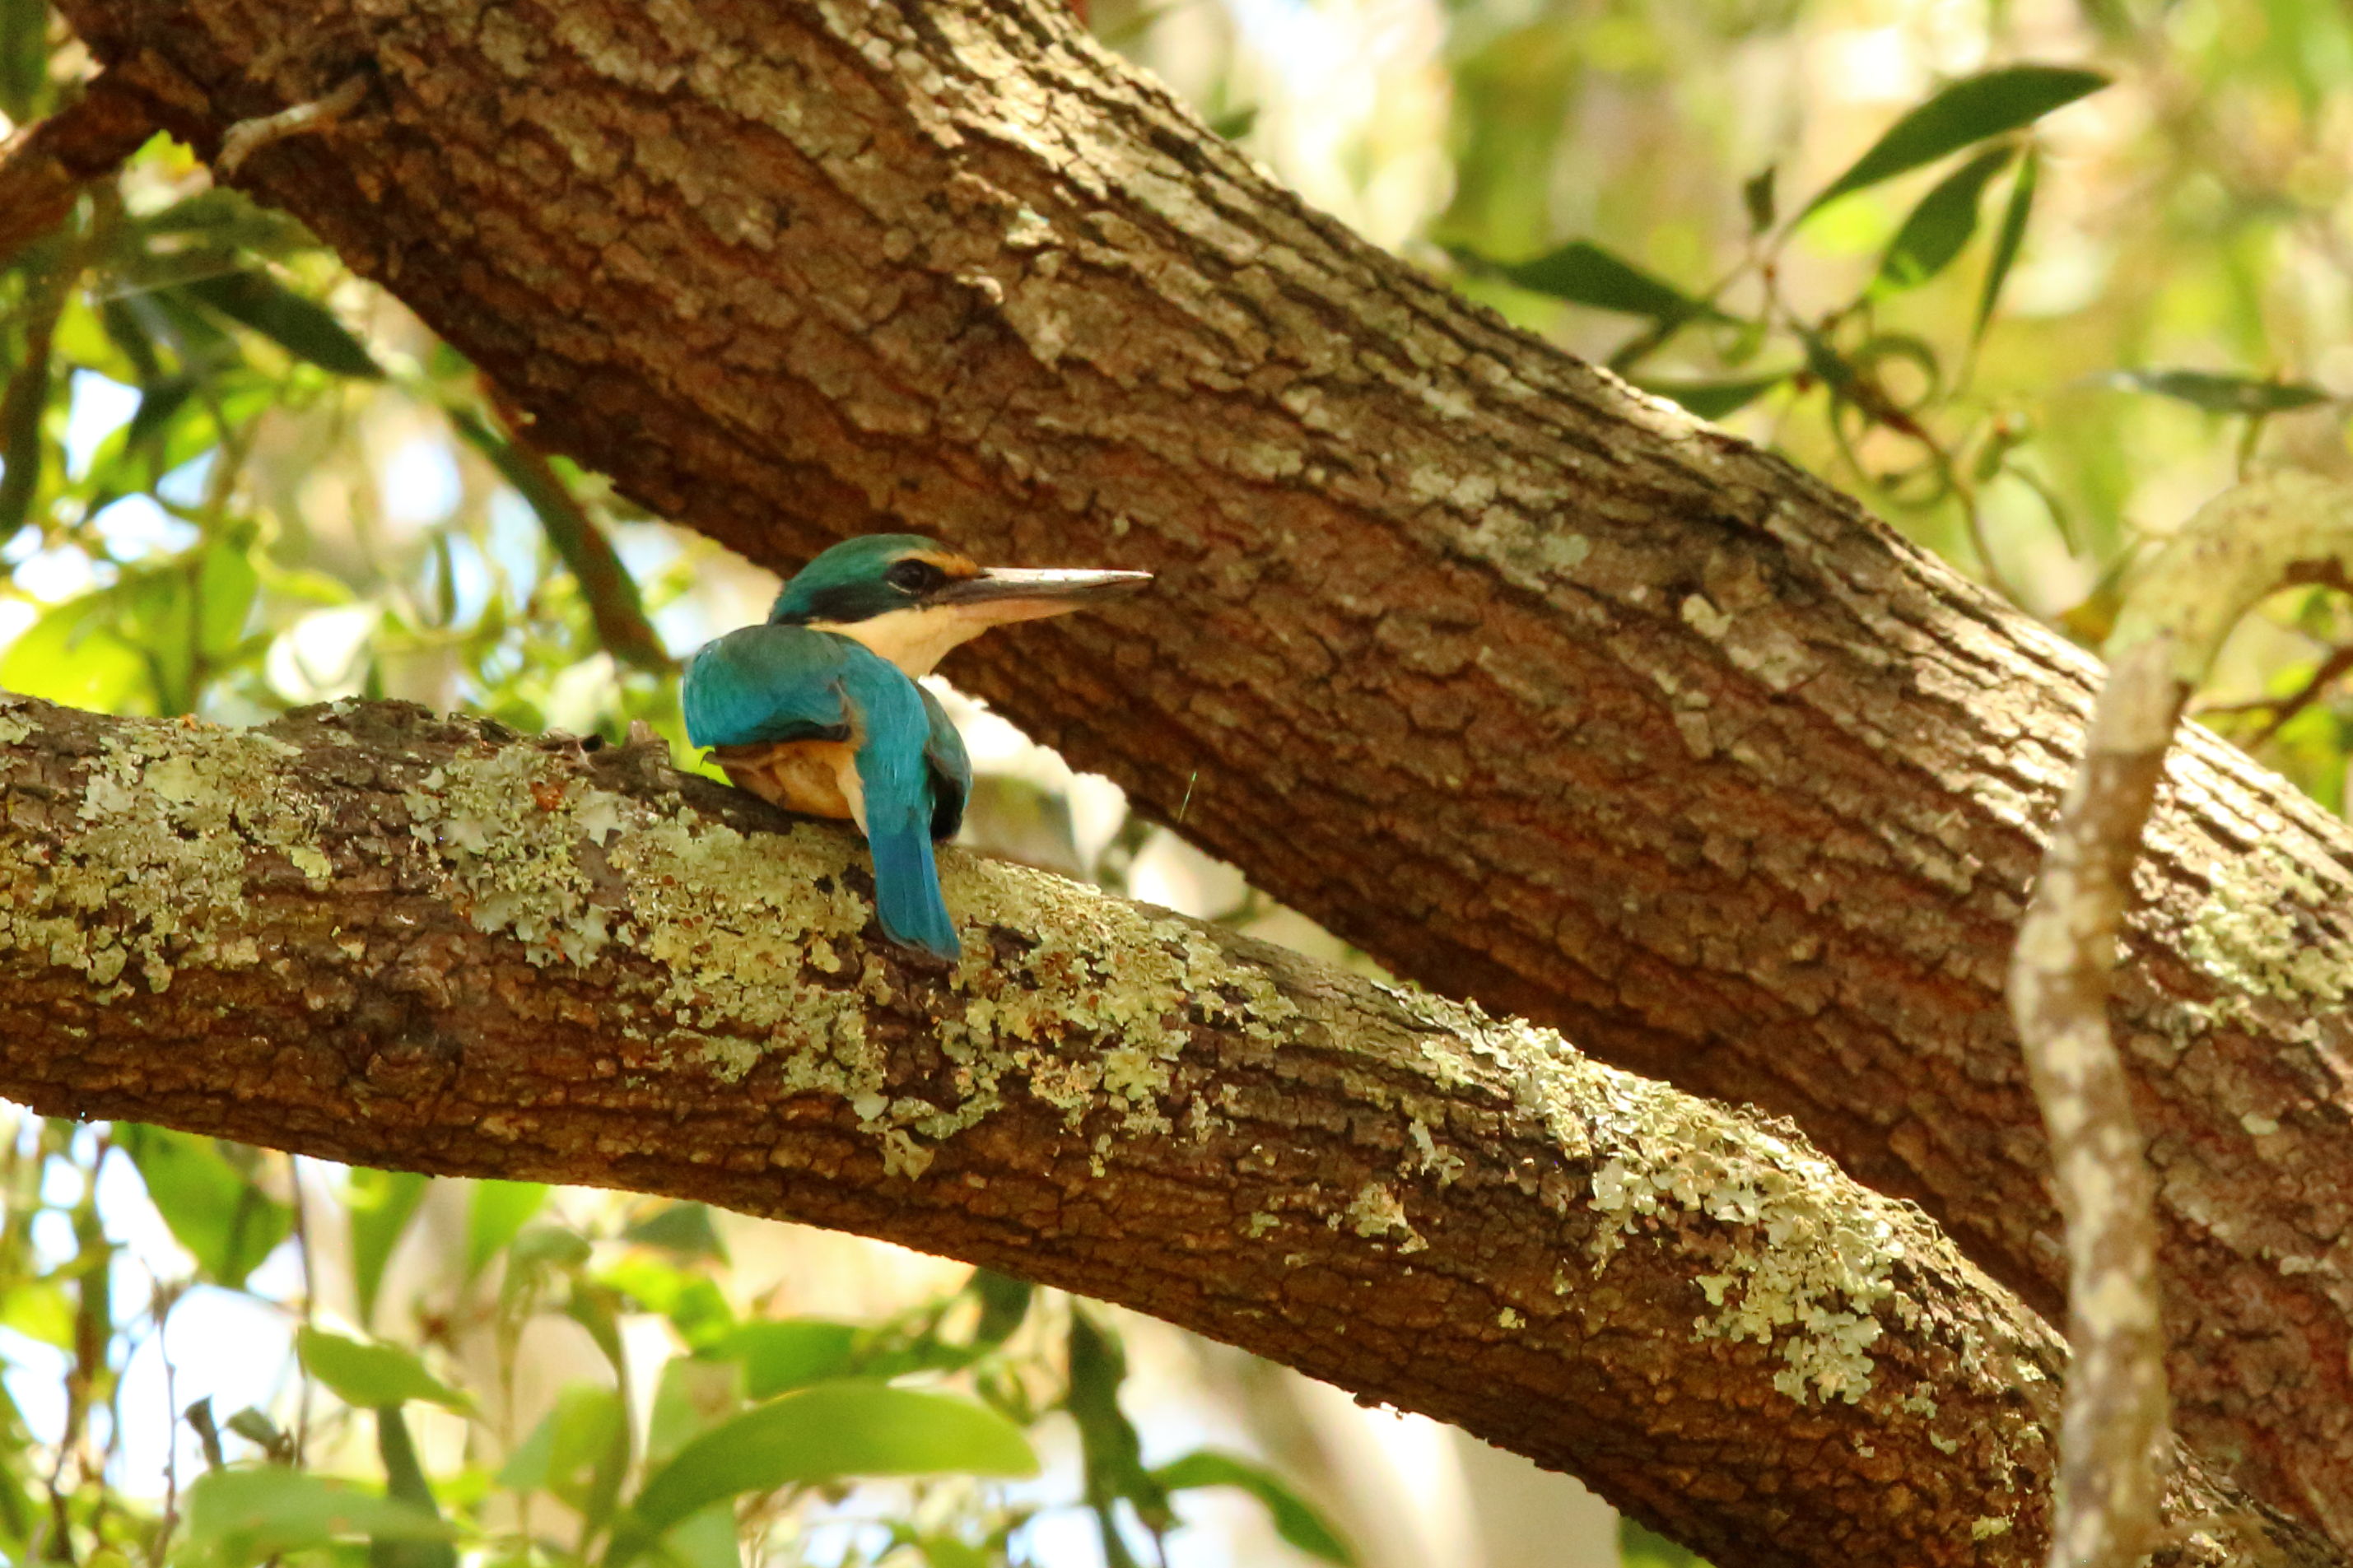
Species like Brolga (Figure 6) are now present in the wetland more often than not (60% of surveys over the last two years), and birds like the Latham’s Snipe and Sacred Kingfishers (Figure 1) are now being recorded.

So, the initial results, post regulator construction, indicate that both waterbird abundance and diversity have increased markedly in response to the increased duration and extent of water and associated changes to floral diversity and abundance, and increased habitat and food web complexity within Walker Swamp. We see diverse and abundant collections of birds feeding across the recently exposed mudflats and in the extensive areas of shallow water, particularly in the north west of Walker Swamp.
What about the non waterbirds?
A lot of birds not normally thought to be associated with wetlands also benefit from having a healthy and productive wetland nearby. The flow of energy and nutrients between wetland and adjacent terrestrial food webs is important to the productivity and diversity of both aquatic and terrestrial ecosystems.
During and after a flood the related increase in primary productivity across a floodplain, and in wetlands, is the basis of a complex terrestrially-based food web. Inundated trees and shrubs like River Red Gums and Teatree provides foraging, refuge and breeding habitat for terrestrial fauna species. Following water recession, the subsequent growth of understorey provides forage for herbivores again contributing significant productivity. Many species that forage in the region will move to the area for refuge and breeding. Heterogeneity in lowland floodplain macrohabitat has been shown to significantly increase local avian biodiversity (Parkinson 2002).
There is also an additional faunal-mediated transfer of energy and resources from the aquatic environments to the adjacent terrestrial environments, increasing the productivity of those terrestrial environments (Ballinger and Lake 2006). The emergence of adult insects from the water contributes significantly to riparian consumers such as insectivorous birds, bats, lizards and spiders (Baxter et al. 2005). Densities and diversity of non-aquatic woodland bird species, for example, have been shown to increase significantly with the presence of wetlands in woodlands when compared with equivalent woodland habitat without wetlands (Parkinson et al. 2002, Ballinger and Lake 2006). Foraging bat activity has been correlated with insect abundance along riparian zones (Ballinger and Lake 2006, Fukui et al. 2006), with flux of aquatic insects emerging from streams identified as one of the most important factors affecting the distribution of riparian-foraging bats. In tropical Australian savannas total bat species diversity was found to be associated with distance to rivers and rainfall (Milne et al. 2005). This exchange may influence ecosystem productivity at the landscape scale (Ballinger and Lake 2006), bringing about breeding activity and population growth across a suite of faunal species.
The fauna community associated with a floodplain and riparian zone, and wetlands is therefore complex and diverse, with many species that make use of the area in differing ways and which are reliant upon inundation of the floodplain and wetlands and the presence of healthy floodplain and riparian vegetation as the basis of the community. Survey results so far at Walker Swamp reflect restoration of this complexity with both waterbird and non-waterbird species richness on the up-trend!
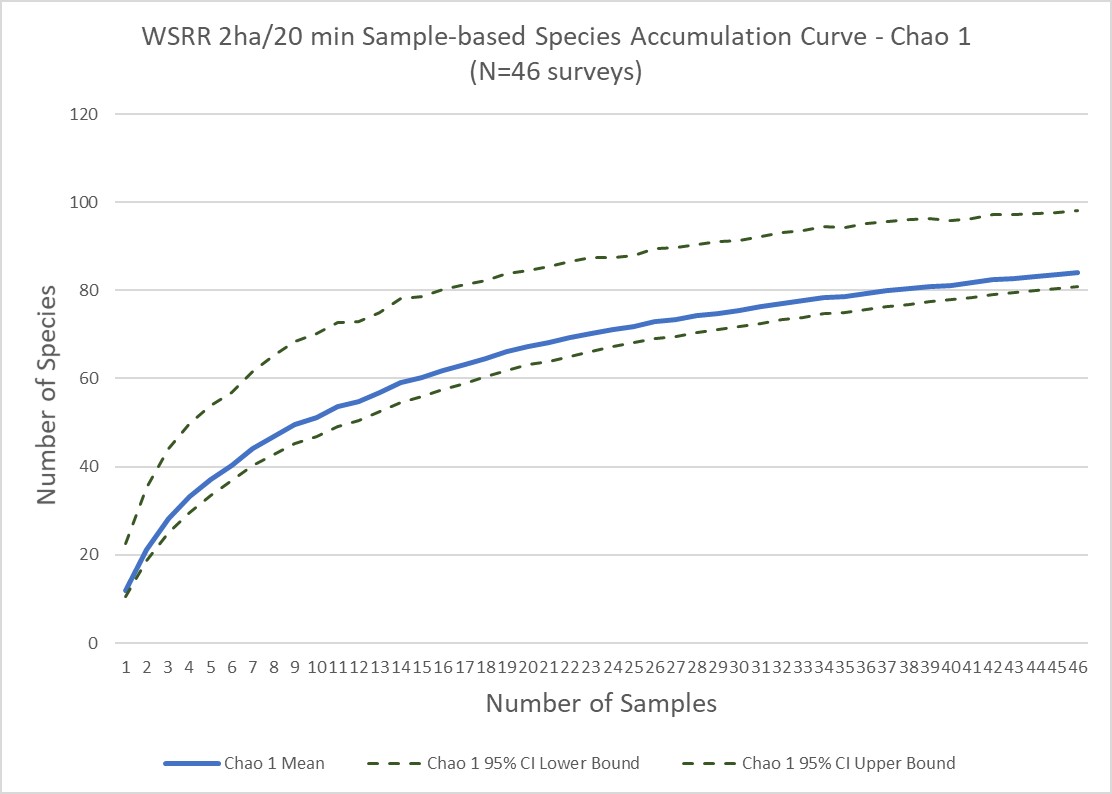
Eighty bird species were recorded in 46 2ha / 20min surveys at six repeat sites and five one-off sites in the Reserve between 01/11/2018 and 15/01/2020. A sample based species accumulation curve (Figure 7) for all 2ha / 20min surveys at the WSRR reveals that new species were still being added when sampling stopped (Last survey 15/01/2020) and that the asymptote had not been reached. Recent changes to wetlands and nearby habitats across the WSRR have been significant and are ongoing. These changes are likely impacting the diversity an abundance of bird species using the area. Under these conditions of ongoing change, it is unlikely that an asymptote to the species accumulation curve will be reached in the near future and so ongoing survey effort is required.
In a normal and diverse community a handful of species contribute most of the abundance and typical contribute significantly to ecosystem function. If some species are common, many more are rare. But, rare species are an important component of a diverse system and may play critical roles in a community, for example as pollinators. A Whitaker (Rank Abundance) plot of species abundance data for the logarithmic series at Walker Swamp (Figure 8) gives the expected nearly straight and steep gradient (Krebs 1999, McGill et al. 2007). That is – the most abundant or common species occurred in a much greater number compared to the less abundant species.

Of the 80 species, 10 species (12.5%) are singletons (i.e. recorded only once in all surveys: Horsfield’s Bronze-Cuckoo, Shining Bronze-Cuckoo, Brown Goshawk, Australian Hobby, Blue-winged Parrot, Musk Lorikeet, Golden Whistler, Grey Currawong, Rufous Songlark, Common Blackbird). Remembering that only a 2 ha area was surveyed each time, this is not unexpected as many species have very large home ranges. Two of these species are raptors and normally in low abundance, the remaining eight species are rarely observed in the area / these habitats. Ten species (12.5%) are doubletons (Australian Shelduck, Masked Lapwing, Wedge-tailed Eagle, Whistling Kite, Brown Falcon, Yellow-tufted Honeyeater, White-winged Triller, White-throated Needletail, Mistletoebird, Red-browed Finch), two of these are wetland specialist and unlikely to occupy this habitat and three are raptors and likely in low abundance. The remaining five species are rare in this habitat. The most often recorded species in the Reserve were: Crimson Rosella, Long-billed Corella, Yellow-faced Honeyeater, Australian Magpie, Superb Fairy-wren, Brown Thornbill, Yellow-rumped Thornbill, Red Wattlebird, Buff-rumped Thornbill.
Murray et al. (1999) found that most (90%) species in the tails of local rank–abundance curves are substantially more abundant somewhere else and that there exists a small but still interesting group of species that are sparse everywhere. Most of the species identified above as rare in the Reserve would appear to fit into the first group being more abundant elsewhere or in the case of the raptors in low abundance on a large geographic scale.
When comparing diversity among the habitat types within Reserve, the Sand Forest (EVC134) in relatively good condition supports the highest diversity of bird species relative to the Plains Grassy Woodland (EVC55) (Figure 9A). Areas that have recently had blue gum plantations removed support the lowest diversity of species (Figure 9B).

A. (left): Ecological Vegetation Class (EVC) habitat type B. (right): Habitat condition.
To allow for a valid comparison of species diversity between each of the six (non-waterbird) sites an empirical cumulative distribution function (eCDF) for each ecological community (monitoring site) was created (Figure 10). To create this graph both axes are standardised (dividing by each site’s species richness and total abundance). This means that communities with higher diversity (more bird species) can be compared with other communities that have lower diversity and/or abundance. In so doing, the richness-independent graph allows a valid visual comparison between sites.
The slope of these lines indicates species evenness (evenness is a measure of how different the abundances of the species in a community are from each other). The traditional assumption is that undisturbed communities of birds follow a log-normal pattern of species abundance and that this is replaced, following some sort of impact on the habitat, such as clearance, by a less even geometric series distribution (Magurran 2004). So a healthier, more natural, bird community has a flatter line more to the left. The increasing slope evident from Site 001 (dark blue) through Sites 002, 004, 003, 005 to Site 006 (green) suggests an increasing gradient of disturbance (better habitat on the left, poorer habitat on the right), with an impact on both species’ abundance and diversity at the site.
The least disturbed community is Site 001 (dark blue). Those of you who have been to a Walker Swamp open day will know this site as the Sand Forest community in which we gathered, either in the marquee or the shed in the centre of the Reserve. Forty-four bird species have been recorded in this site. Some species are very common (nearly 10% of all the birds) and there is a gradual shift through to a group of other species that are rare (around 0.3% of all birds).
This compares with a total of 18 species recorded in Site 006 (green) in the middle of a recently harvested blue gum community. Looking at the graph you can see that site 006 is very different in evenness. The evenness is much higher as the line is more sharply vertical. This suggests that most species in the middle have an abundance of about 3% of the total population. Again, the sites where blue gum have recently been removed (Sites 005 and 006) are showing the highest level of disturbance.
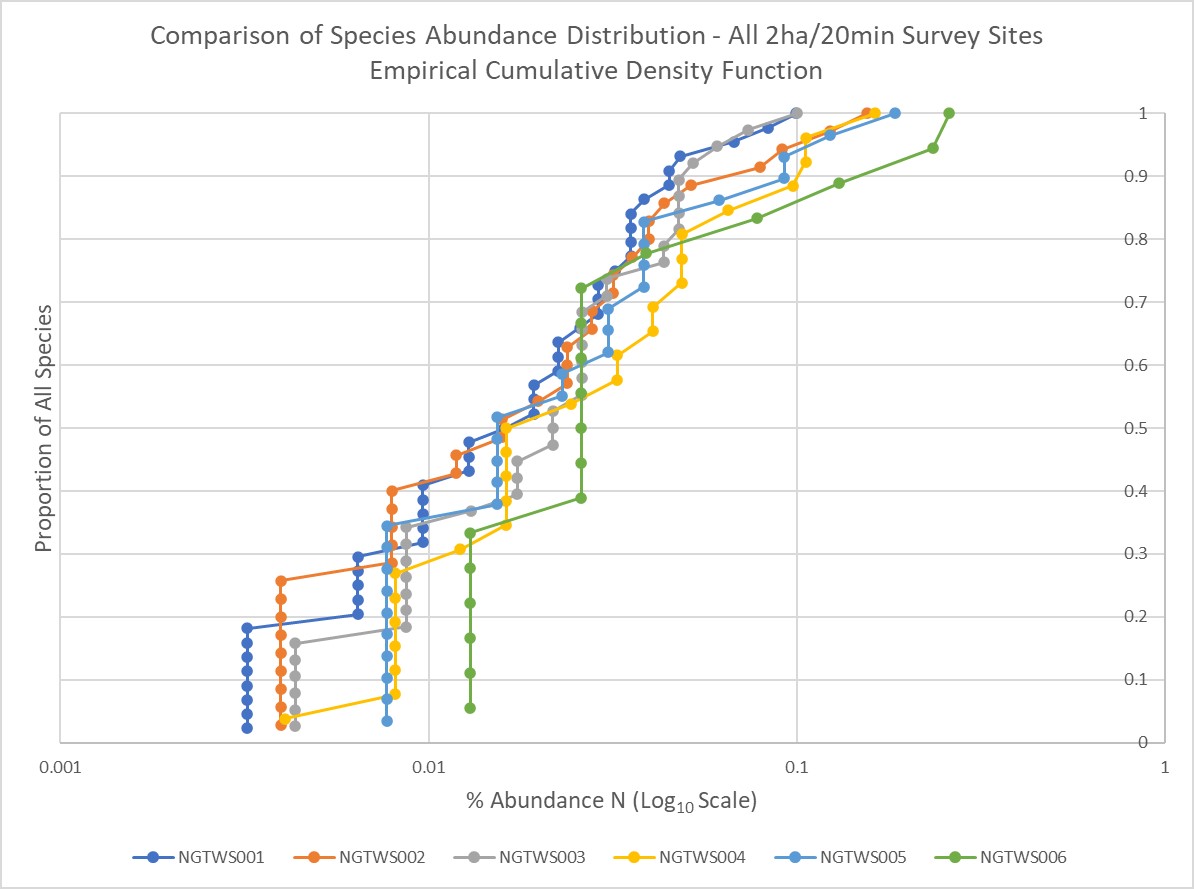
Figure 10: Empirical Cumulative Distribution Function comparing species abundance of non-waterbirds across the six 2ha/20min survey sites at Walker Swamp Restoration Reserve.
As different habitat types recover and change across Walker Swamp in response to our restoration efforts over the last five years, ongoing changes to the diversity and abundance of terrestrial bird species (and biodiversity more broadly) can be anticipated. This initial survey work in the WSRR has recorded approximately 55% of the likely diversity of ‘terrestrial’ species found in the region (Birdlife Hamilton and Hamilton Field Naturalist Club 2019). Monitoring of avian species and diversity in habitats away from the wetlands will with time enable an analysis of benefits of increased wetland productivity to terrestrial species diversity and abundance.
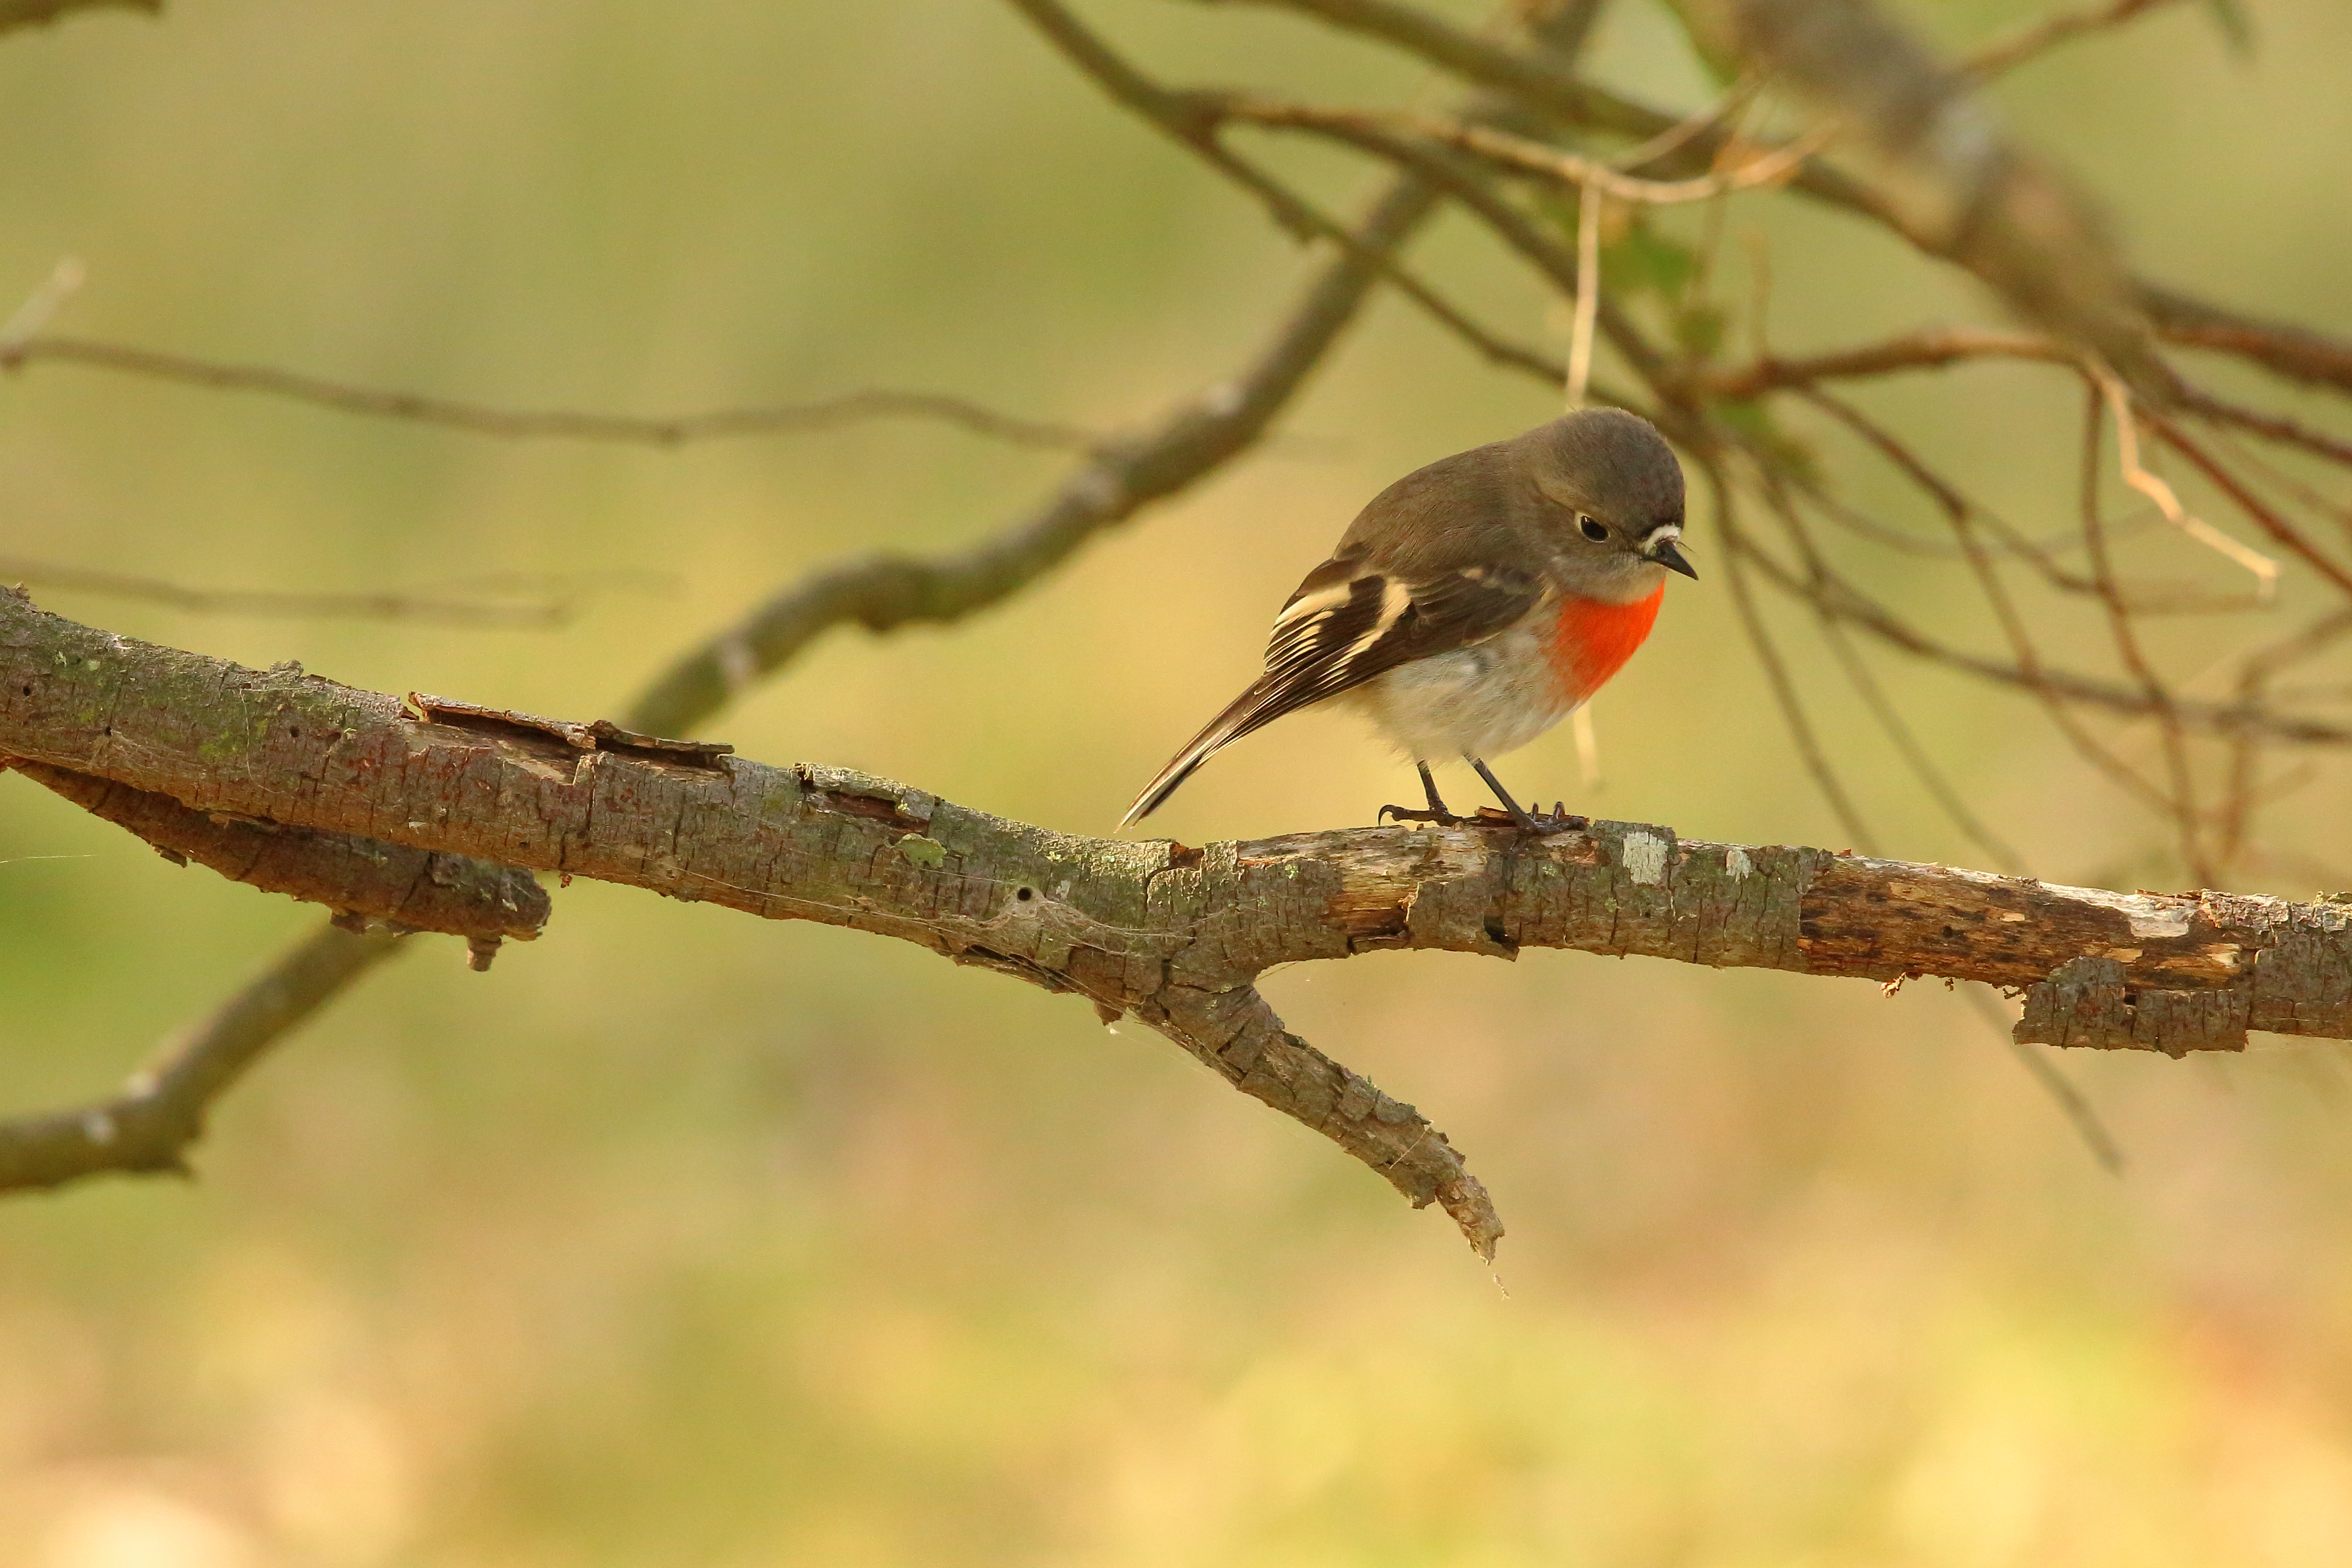
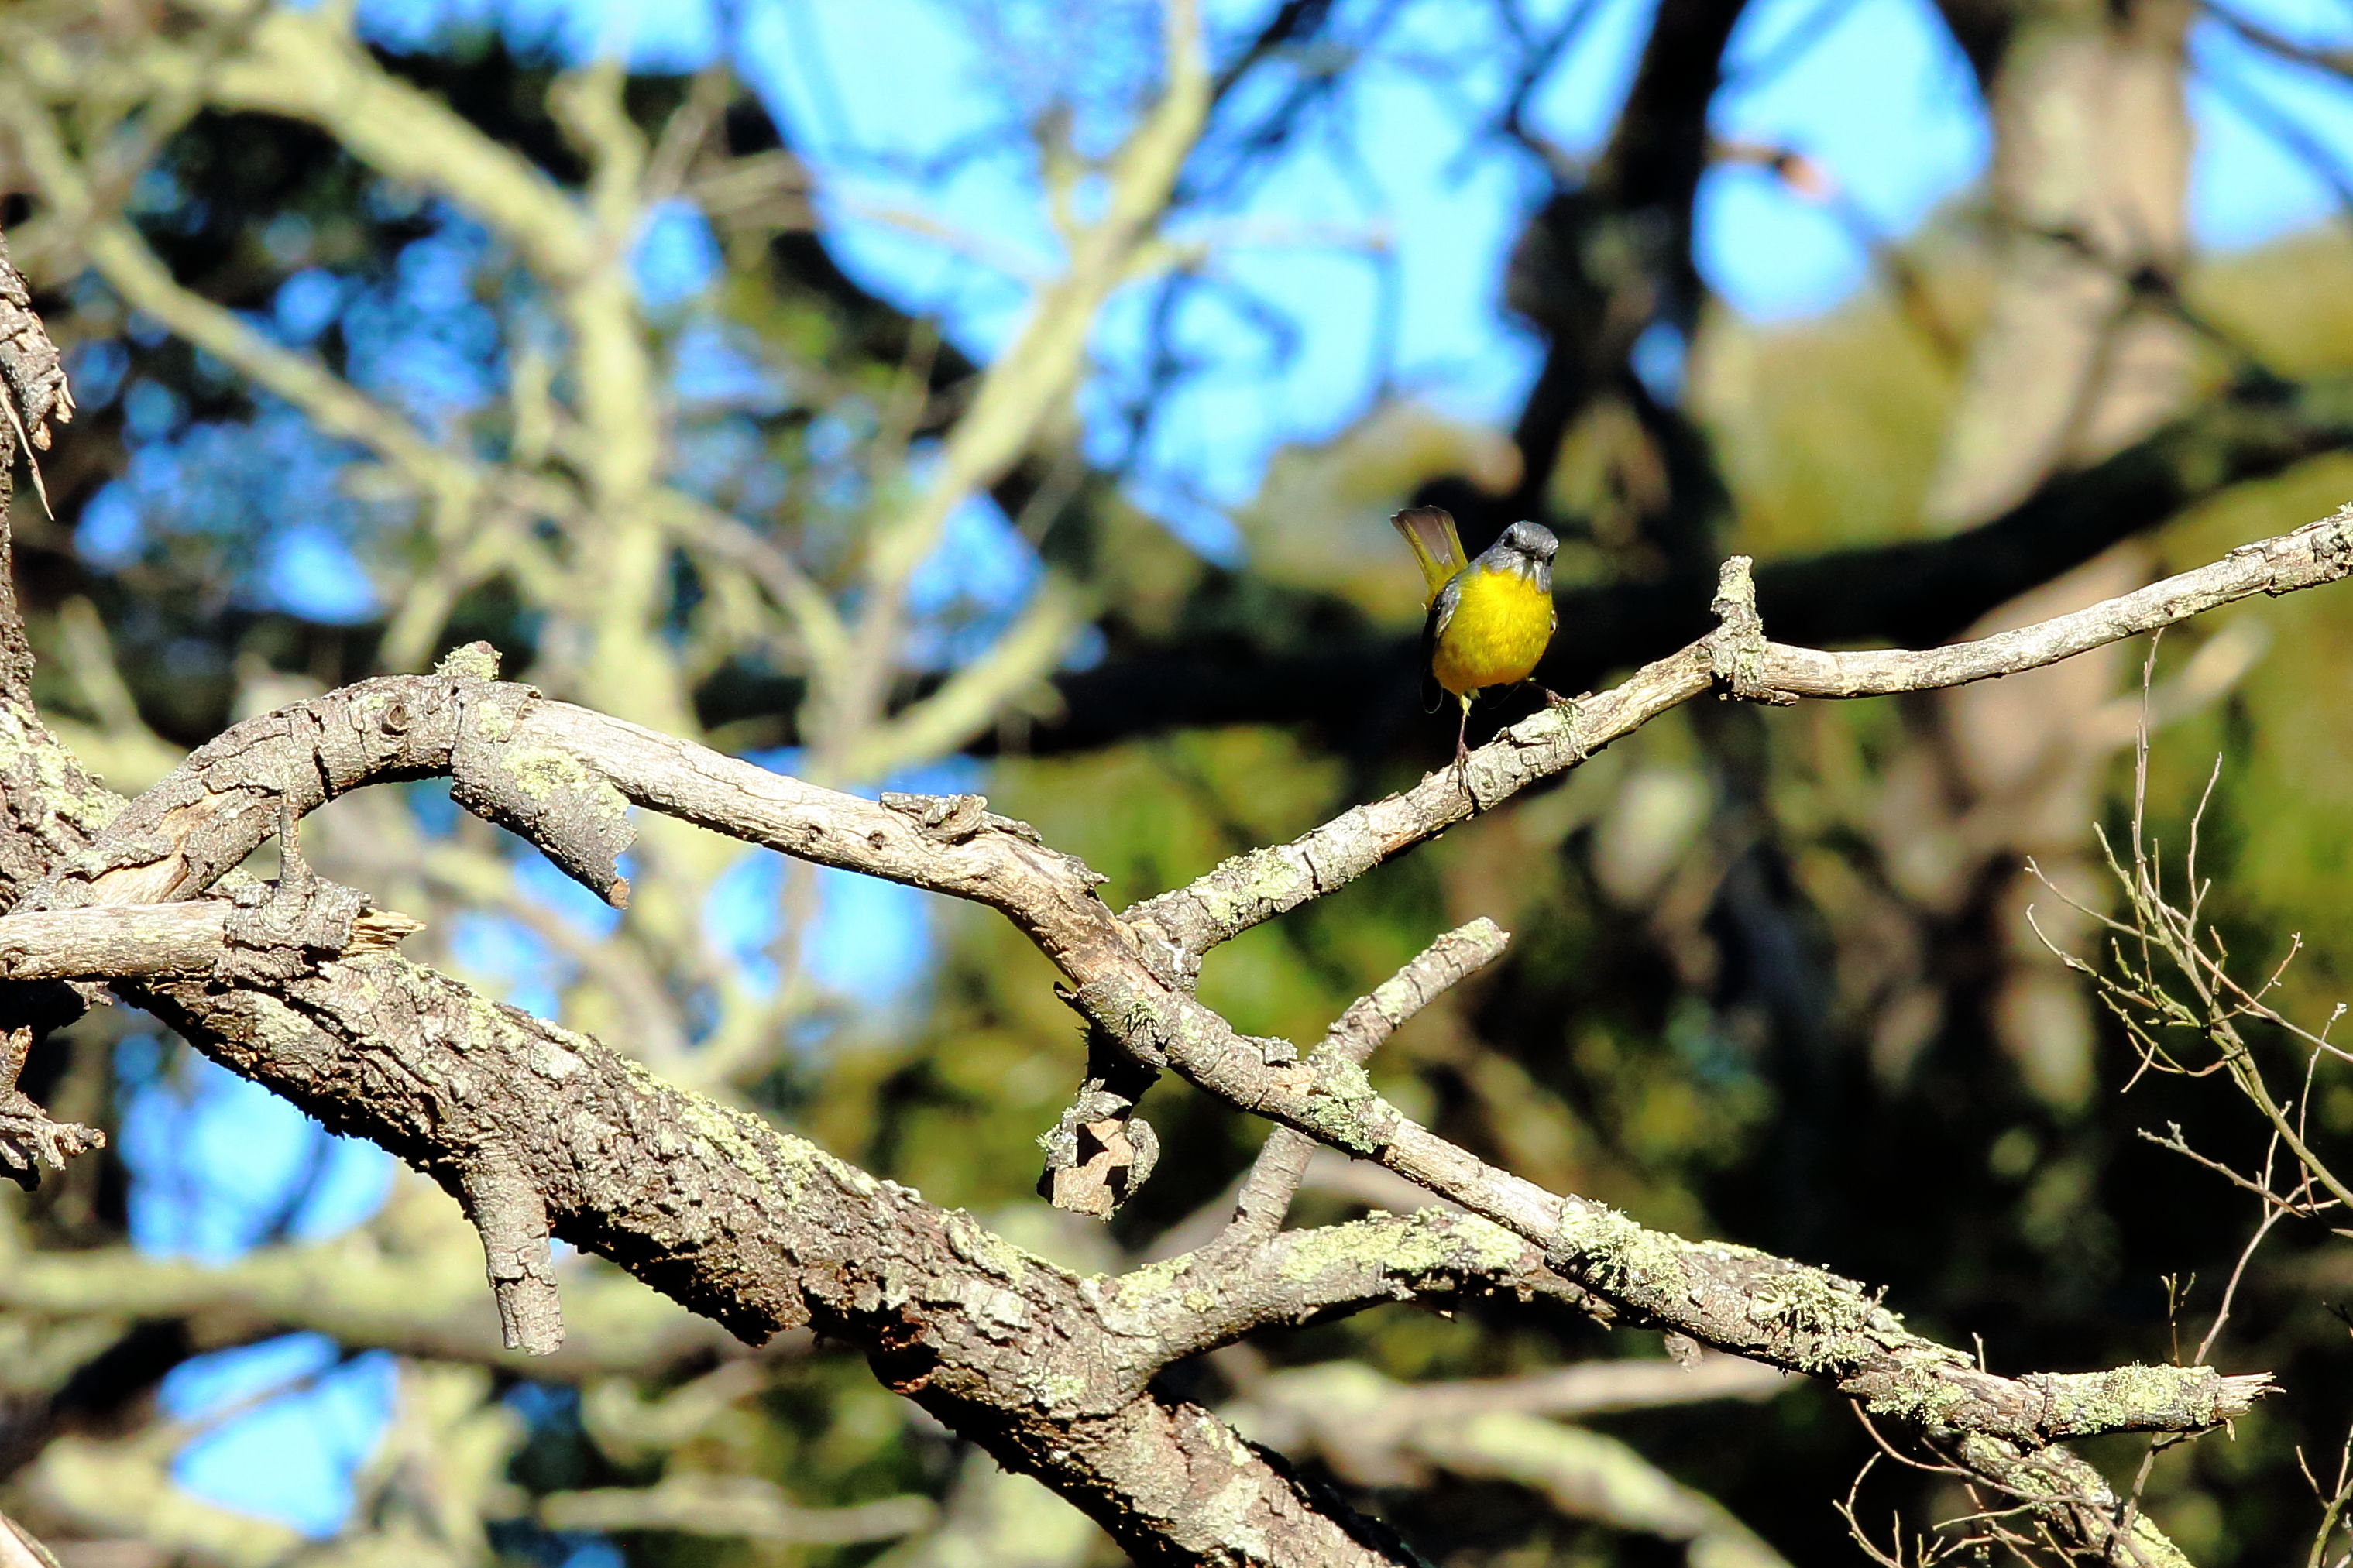
Birds like the Scarlet Robin (Figure 11), Flame Robin, Eastern-yellow Robin (Figure 12) and Rose Robin have been recorded at the Reserve. The Rose Robin has only been recorded once, the Scarlet and Eastern-yellow Robins are recorded year round and the Flame Robin is recorded every winter when it migrates down from the higher slopes in the nearby Grampians.