A glimpse back to the good old days – early season upper Wannon River flows
In the south west of Victoria we are currently experiencing one of the wettest winters for a long time. Driving across the landscape, it has been quite revealing to see lots of wetlands showing their face, and many streams running at levels usually seen in a wet Spring.
We’ve had a particular interest in the upper Wannon River and the wetlands of the floodplain – Brady and Gooseneck Swamp, in line with our restoration focus in this part of the world for almost a decade. We have also recently initiated a project via the Australian Government’s Heritage Grants Program 2020-21, to take a closer look at the ecology and hydrology of the upper Wannon River.
In recent memory, the Wannon River has only played a fairly minor role in delivery of water to these wetlands, and many people who live along the Wannon River have noticed a dramatic shift to lower flows. We’ve been more used to seeing flows only start to come through from late August to September but this year, the river has been feeding the wetlands from mid-July. And it has been quite impressive to see just how quickly these wetlands fill when the river is engaged.
In terms of comparing this year with what we have seen since we started working up here, the flow gauges in the upper Wannon River help to tell the story. The gauges are part of a statewide network managed by Department of Environment, Land, Water & Planning and data can be accessed through an online portal. The information they capture tells us some really interesting things about the historical flow patterns, and helps provide a point of reference to what we see now.
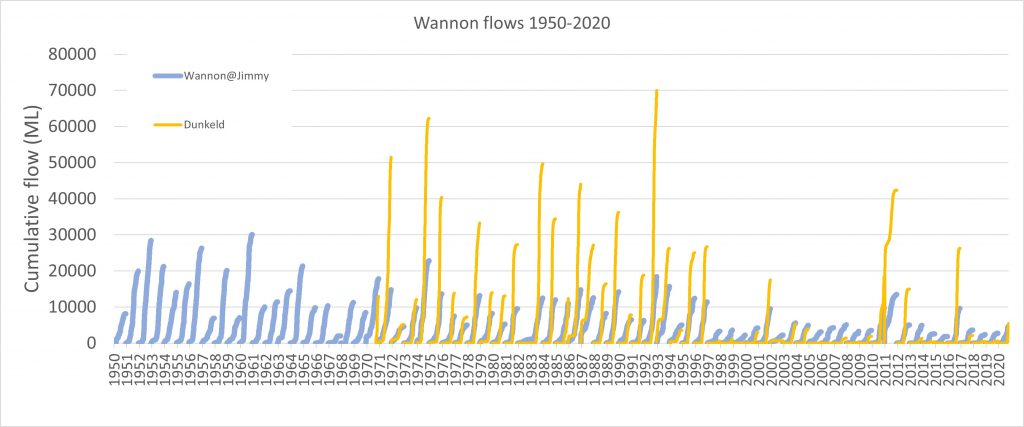
The most apparent trend is the overall declines in flow since the mid-1990s and the fact that flows in the headwaters (above the Jimmy Creek gauge) fail to make it downstream to Dunkeld. Since 1997, the gauge at Dunkeld has only recorded more flow than the upstream Jimmy Creek campground gauge on five occasions, or 20% of the time, compared to 96% of the time for period between 1971 (when records began) and 1997.
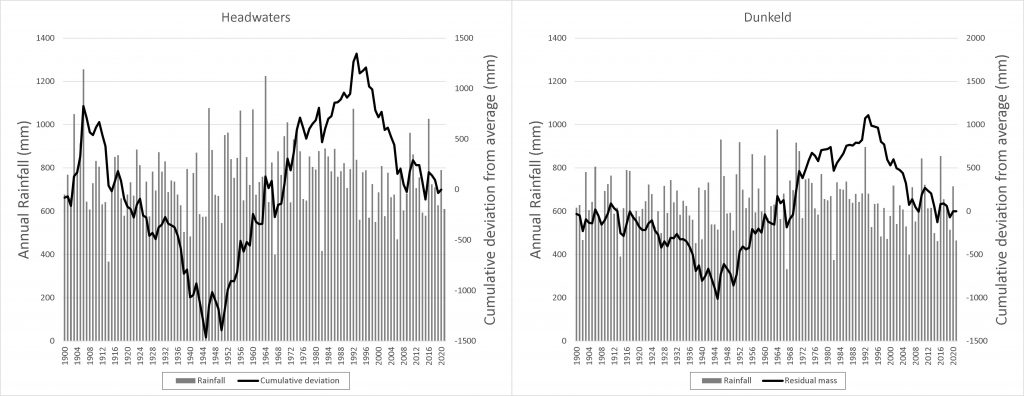
Rainfall is one obvious factor in explaining these declines. The rainfall charts below have been derived from interpolated point rainfall data which is available though SILO (Scientific Information for Land Owners), a database of Australian climate data from 1889. The data is based on the BOM weather station network and its accuracy will vary depending on how many weather stations each point can tie into, and also how long the weather records for each station exist.
Nevertheless, the overall patterns are consistent with what we see across data from actual weather stations in this region. What the charts show us is the annual rainfall and also a line showing cumulative deviation from average rainfall. When the line is going up, there is a general pattern of wetter than average years and when the line is going down, there is a trend of drier years or concurrent years of below average rainfall. We can see that the period from the 1950s to mid-1990s was wetter and there has been a sharp drying trend from the mid-1990s, although the last few years have seen this downward trend tapering off a little.
I’ve had a quick look for the year to date and plotted up some cumulative flow trends for this year at several points along the upper Wannon, including points near the Jimmy Creek campground, Dunkeld and also the amount which is diverted from the headwaters into Lake Bellfield.

The data tells us we are seeing the best early season flows since the downward trend in rainfall in the mid-1990s, with the exception of 2011 which was influenced by a significant summer rainfall event.
Of particular interest is the large difference between the volume being diverted and the amount which is passing the Jimmy Creek campsite gauge. Whether this reflects the onset of flows prior to the diversion becoming operational (from June to October each year), or if it’s just the overall magnitude of flows and capacity of the diversion, is uncertain. However, the fact that almost 80% of the flow at the Jimmy’s Creek campground gauge to the end of July occurred after June 1st and the rainfall recorded at Mount William for May to July was almost 650 mm (the average is 172 mm!) suggests what we are seeing is the result of a very wet winter. And also one which comes on the back of significant late season rain last year.
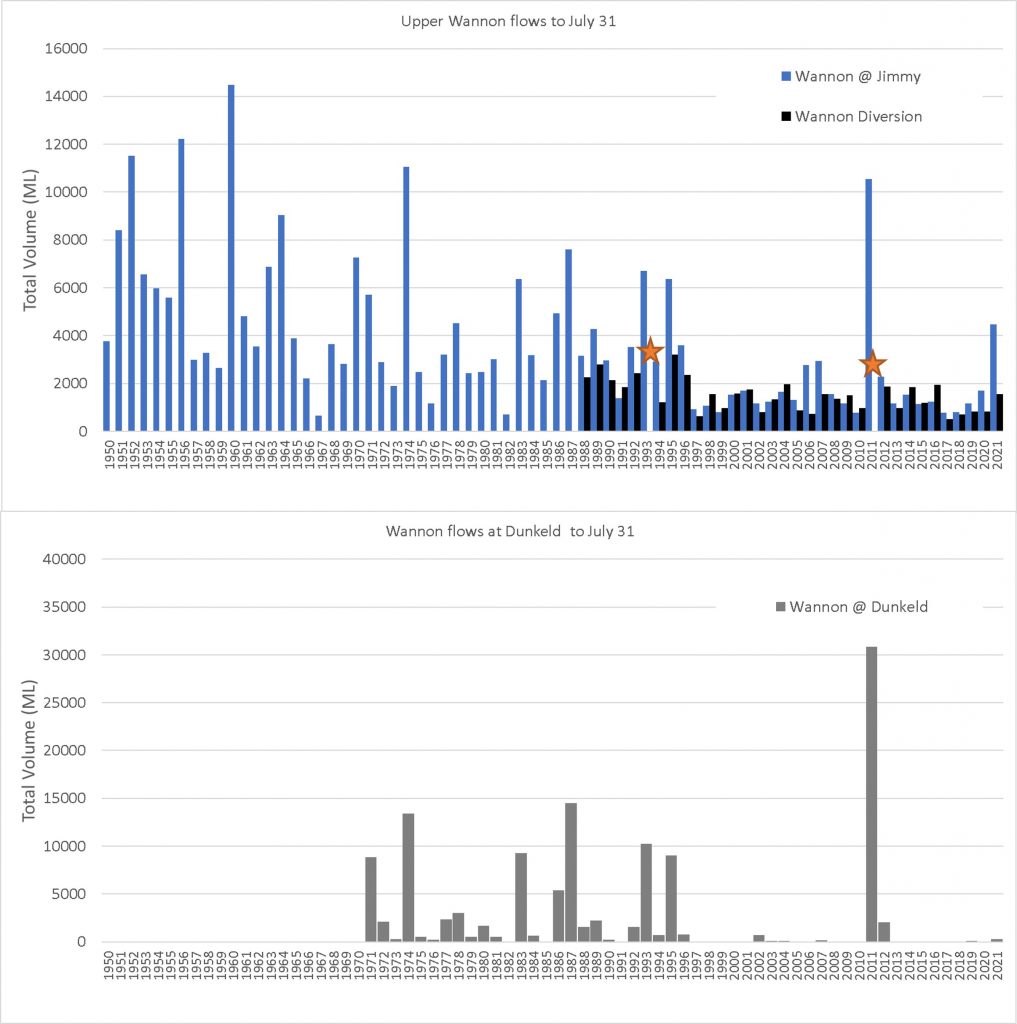
Despite the data not fully reflecting the effect further downstream at Dunkeld yet, August observations indicate that the water has now made its way down the river with the best downstream flows for this time of year in decades. For example, Brady Swamp has been full since the end of July.
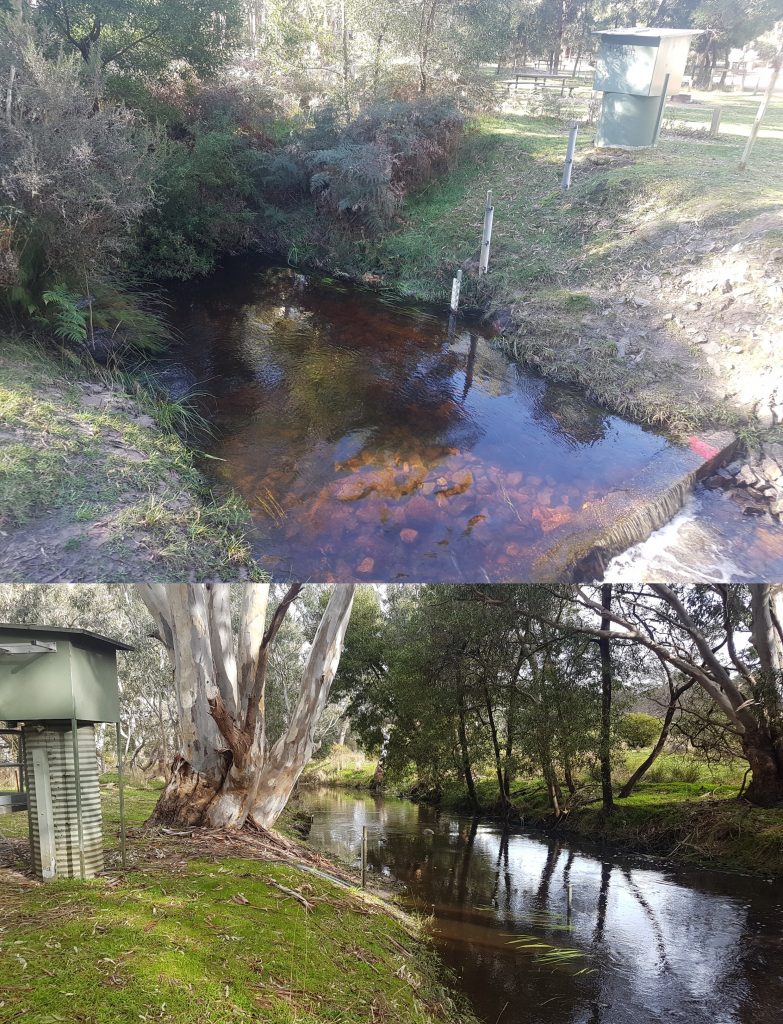
We were also fortunate to have some cameras in place to capture the filling event, as part of New Tech Volunteering: Novel citizen science for Grampians wetlands (you can read the latest from this project here).
So if we look back to the flows of a few decades ago, and also see through this years observations how the upper Wannon wetlands respond to inflows from the river, we can really start to appreciate how their hydrological character has changed and how vital the Wannon River is for maintaining these wetlands.