Wannon River Insights Part 3: How long does it take water to flow through the system, and what is the impact of long-term rainfall patterns?
The Wannon River catchment begins in the Grampians National Park and influences important wetlands like Brady Swamp, Gooseneck Swamp and NGT’s Walker Swamp Restoration Reserve along the way. We have been investigating the Wannon River system for a few years now, through our study into the ecology and hydrology of the Wannon River, funded through the Australian Government’s Australian Heritage Grants Program 2020-21.
To refresh your memory about the upper Wannon River, including how and why the most reliable headwater streams of the Wannon River were diverted towards the Wimmera in 1970, you might like to read Part 1 and Part 2 of this series of articles.
Over the past decade we’ve had some chance encounters with different magnitude flows and have made some estimates on how long water takes to move through different reaches of the Upper Wannon River. We have also spoken to many people who remember the river beginning to flow much earlier than it does now. One of the main things we really wanted to nail down through our study is just how long it takes for the lower reaches within the National Park to hydrate, before water exits the river delta within the park and arrives in the wetlands below (Gooseneck and Brady Swamp). Given the climatic patterns of the past 20 years, I was half expecting a dry run that would have left us still seeking answers by the end of our study, but – if anything – we have actually had the opposite problem! For the first time in a long time, the river pretty much ran all year in 2023, on the back of high flows in the latter half of 2022. But we did have at least one partial capture of the system during it re-hydration phase back at the start 2022.
This water monitoring relies on a combination of existing infrastructure maintained by the Victorian state government, and a network of water level loggers we have installed along the course of the upper Wannon River (see below).
How long does water take to move through the upper reaches?
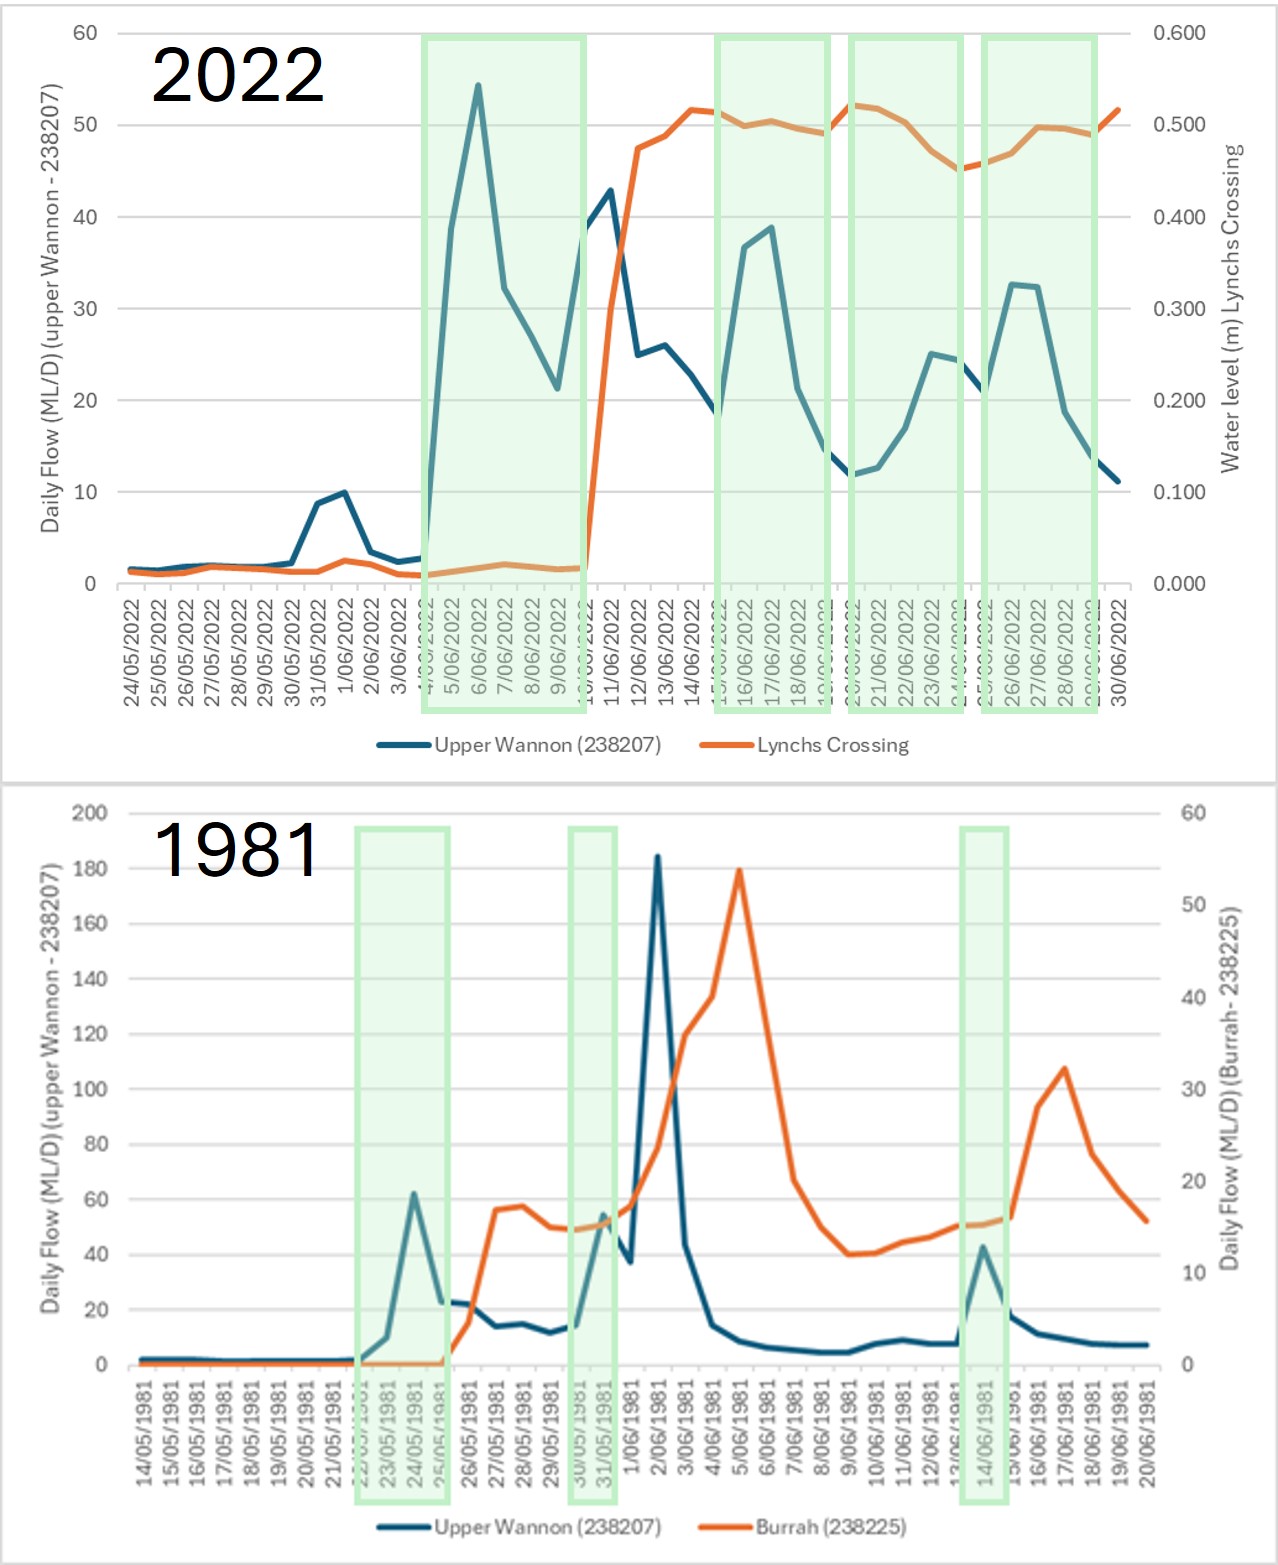
Looking at flow pulses in 2022, we we able to gain an understanding of how long water takes to pass between the points shown above. In 2022, the first flow pulse of the year occurred on 30th May, followed by a second, higher pulse on 4th June. Water levels at Lynchs Crossing proceeded to rise on the 10th of June and mirrored flow pulses in the Upper Wannon from this point onwards. The lag time between flows was initially 6 days but for successive pulses was shorter (4 days). This indicates that once the primary watercourse is saturated, flows are conveyed more quickly.
It is interesting to compare this timing with some historical data, available via the (now decommissioned) Burrah gauge, located near where we have established the Lynchs Crossing logger. The Burrah gauge collected data from 1974 to 1987. Over this period the latest that any flow re-commenced (>0 Megalitres per day) for the year after drying down, was in April (in 1981 and 1982). The timing of the initial higher flow pulse in 1981 was remarkably similar to what we saw in 2022 (occurring at the end of May). However, (despite this being a drier anomaly for the period) the lag time between flows was less, taking 3 days in 1981 (compared to 6 days in 2022) to reach the Burrah gauge (equivalent location to Lynchs Crossing). And successive pulses took 2 days (compared to 4 days in 2022). A comparison of the two different events is provided below.

Long-term Drying Trends in Surface Water:
The start of 1983, which (given the Ash Wednesday bushfires) really needs no introduction as a significantly dry period, also replicates this 3 day lag between the initial flow pulse in the upper Wannon River and flows at Burrah (Lynchs Crossing). It is clear from these comparisons that the upper Wannon River catchment is taking longer to wet up following flow cessation, providing clear evidence of a longer-term drying trend.

This drying trend is also evident when we look at two additional data sources. Firstly, a long-term analysis of flow patterns in Jimmy Creek, which is part of the national hydrologic reference network, shows a step-change decline in annual stream flow since the mid 1990s. This trend is similar across all of southern Australia, and is likely the result of a climatic shift in rainfall patterns (Zhang et al. 2016). Jimmy Creek is one of few major tributaries in the Grampians (Gariwerd) which is not impacted by artificial hydrological modification by humans (damming or diversion).

Drying Trends in Groundwater:
Groundwater trends also signify this pattern of drying. An observation well, located near Lynchs Crossing (and the site of the decommissioned Burrah gauge), shows a declining trend. What this chart shows is that the episodic wetter periods we have had (2011, 2016 and 2022) are – although clearly welcome – not providing sufficient recharge to make up the losses incurred through successive intervening dry years. Things have leveled off since the cessation of the “millennium drought” although the impact of even a couple of drier years (2015 and early 2016) are enough to pull things back. Clearly the system, and the natural ecosystems it supports, is stressed, vulnerable and at risk.

The Wannon River Delivers Important Fresh Water to Swamps:
We have also been able to get some insights into how long water takes to move through the Wannon Fan. The Wannon Fan is an alluvial delta which extends eastward, out of the National Park as the river leaves the valley at the southern tip of the Mount William Range (below Lynchs Crossing). In the past, we have been unable to determine whether initial rises in water levels in Gooseneck Swamp (at the bottom of the fan) were due to Wannon River inflows or inputs from the Bunnugal North Drain, via Walker Swamp. Following the regulation of these drain flows through hydrological restoration of Walker Swamp (which has had an attenuating effect), we now have a better understanding of where the water is coming from, and when it is arriving.
In 2022, during the same period we monitored flows through the upper Wannon River, Walker Swamp had yet to fill and spill prior to Gooseneck Swamp starting to fill. Based on these observations we can estimate that the time it took from the first pulse passing Lynchs Crossing, to filling of Gooseneck Swamp was 7 weeks. Unfortunately we don’t have any historical data to compare, so can’t look assess how this has changed over the past few decades but, based on the nature of the tea-tree covered delta, and the vast amount of area which needs to be filled before the river can push through, it is high likely that this lag-time has also increased dramatically on the back of cumulative rainfall decline. Fortunately for Brady, Gooseneck and Walker Swamps they have an additional form of artificial ‘life support’ as a result of artificial drainage inputs (via the northern and southern Bunnugal Drains). However, the contribution of the Wannon River is still vital for these wetlands because the water it delivers is fresher (lower in salinity). You can see this in the different types of plant communities across Brady Swamp, with the northern area (closer to the delta inflow points) showing more freshwater characteristic species and the southern area (closer to the southern Bunnugal drain inlet) showing more salt-tolerant species.

Understanding this background effect of climate on flows of the upper Wannon River is an important part of the whole water management decision process for not only this particular river, but all of the waterways being utilised for human consumption in Gariwerd. For the Wannon River, the ongoing decline in the average amount of water reaching downstream communities is well acknowledged – however, contrary to what many believe, this isn’t only because the headwaters are being seasonally diverted. In fact, the annual diversion volume alone would not offset these climate induced changes we are experiencing.
However, the fact that the yield of the catchment is declining brings into focus a key question for water planners and policy makers in Victoria – exactly “what does responsible future water resource management look like for the Wannon River?”
If we know that the resource is no longer as reliable as it used to be, the diversion of water away from the upper Wannon River to Lake Bellfield will have an increasing and disproportionate impact on downstream river flows and ecology. In this context, any new projects that create fresh demand for water from Lake Bellfield and other reservoirs in the Grampians (like the East Grampians Rural Pipeline project, currently underway) need very careful thought. Diversions aside, are we potentially basing future agricultural development investment decisions in the surrounding regions on an erroneous assumption about the security of the water resource and – crucially – without having fully considered the trade-offs involved for Grampians catchments and downstream communities impacted by flow diversions?
There are also additional nuances in the timing of headwater flows for replenishing stressed ecosystems (i.e. permanent refuge pools and the aquatic fauna which rely on them). If the first pulses after a dry period continue to be compromised by total diversion at the beginning of each winter, then they are under an even greater threat than that posed by this climatic shift. In the Wannon River, we have a chance to build some resilience back into what is a very unique yet vulnerable ecosystem. Aside from the diversion works completed in 1970, this is an otherwise in-tact and almost unmodified waterway, situated within an Australian Heritage Listed National Park – so it certainly warrants our attention.
Perhaps this is a chance to start adapting our expectations around future water security and rethinking the way that we meet the needs of a vital river reach, whose water needs have largely been overlooked since 1970? Based on our research, reviewing and adjusting the diversion operating rules to ensure that the upper Wannon River receives the early winter ‘wetting up’ flows once again, which are currently diverted away in their entirety towards Lake Bellfield, would be a sensible and really strategic place to start.

This project has been supported by the Australian Government’s Australian Heritage Grants Program 2020-21