Water levels and rates of filling across Walker Swamp in 2020
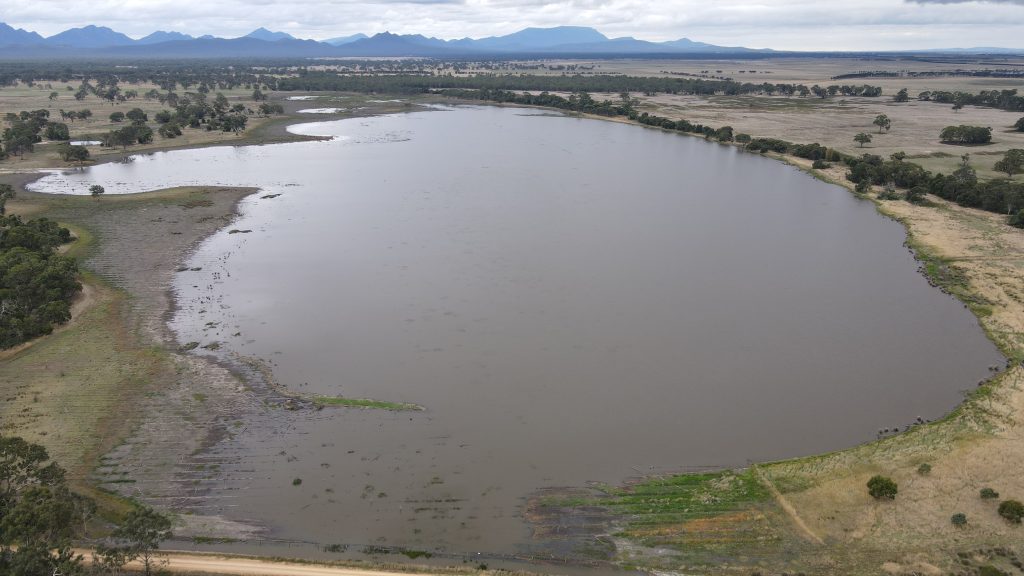
Late last winter we were feeling less than optimistic about how the season was unfolding, albeit with a glimmer of hope from the BOM long-term forecast. Fortunately, that forecast was correct and we experienced the best spring rainfall we have seen since working across these wetlands. Early October rain, which caused flooding across parts of southwest Victoria saw the newly restored Walker Swamp fill sharply, with water levels rising nearly one meter in one week! It was a fantastic opportunity to see our restoration design come to life (you can see what that looked like here).
I had been waiting for the water levels to drop so I could retrieve some of the water level loggers, and have a closer look at how the water levels responded. Retrieving the data is usually straightforward but this past year threw in some new challenges because the water levels rose above our water level gauging stations and they were hard to find until the water level dropped.
This numerical look at the pattern of filling across Walker Swamp (shown below) sheds light on some of the more subtle design concepts. The backfilling of drains was incorporated to help spread water uniformly over the bed of the wetland as water came in, rather than funnelling along the drains to the deepest point. This can be seen by the lag in response between water levels at the top of the wetland (Walker Swamp Top – green line) where it took around a week for the levels across the entirety of the main wetland to reach a uniform depth. As the wetland dries down, topography will mean that water will remain in depressions across the bed of the wetland rather than being concentrated into the (now removed) drainage footprint.
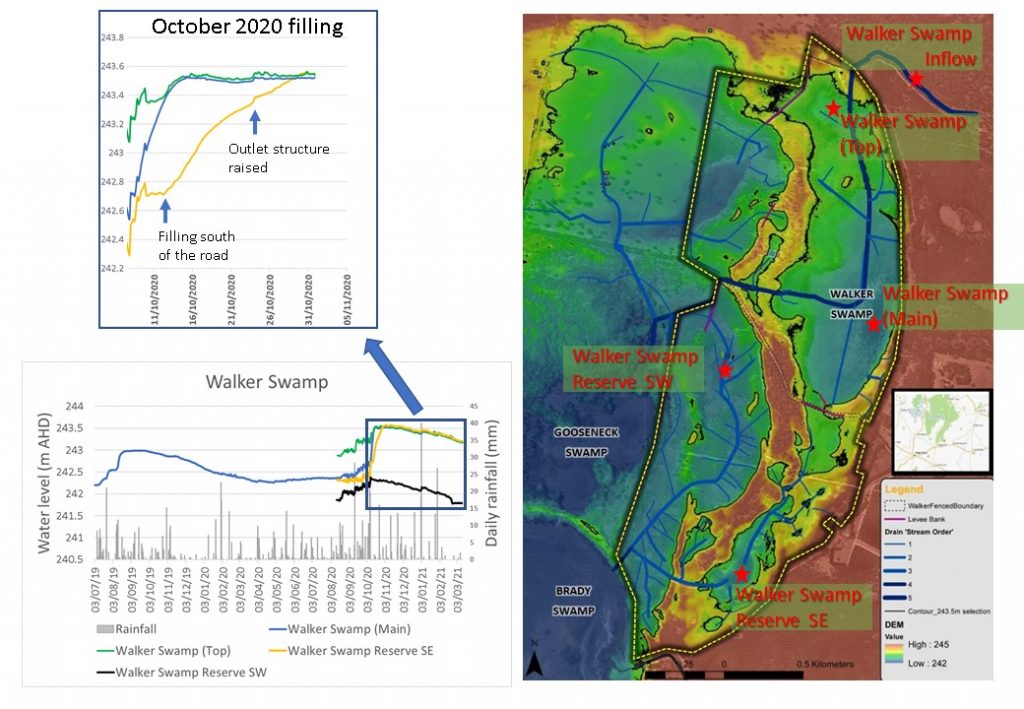
Another key aspect of the restoration design was the capacity for flows to pass to the southern section of the road, as it would have prior to construction of Lynches Cross at the southern of Walker Swamp. During big events this did happen to some extent but resulted in the road being inundated. By building up the road, and incorporating some culverts, we aimed to allow flow to travel south as the water in the main wetland rose. The ability to manually adjust the full supply level of the wetland at the main outlet was critical in optimising this, and we initially set the structure conservatively to allow us to observe how the design functioned in real time.
When the main wetland spilled at the regulation structure, our perimeter checks indicated that the wetland still had some capacity and, despite water moving under the road, the rate of flow was below what the culverts were capable of delivering. With a quick bit of manual adjustment, we raised the height of the regulation structure, backing off the outflows and forcing more water south. The water level data for the southern wetland (Walker Swamp Reserve SE – yellow line) shows the level rising once the main wetland had reached 242.7 m AHD but the rate of rise starting to taper. The date where we manually adjusted the outlet level is apparent in the water level data for all loggers across the wetland system, but is particularly pronounced for the southern wetland where level rise picked up again until the whole system equilibrated at 243.5 m AHD, our originally modelled and envisaged maximum full supply level. It was a great example of how the incorporation of sandbags can be used to provide not only a robust structure, but allow fine tuning alongside ground-truthed observations of design function.
The other observation of interest is the water levels in a wetland area which is not connected to the drainage system feeding Walker Swamp. This area (Walker Swamp Reserve SW) currently only receives local inputs (rainfall and adjacent runoff). We can see a similar filling in response to rainfall (also note a significant event in early January) but once the rain abated, levels started to drop. Historically, this area was connected to the Wannon floodplain, as part of Gooseneck Swamp but is currently partly disconnected by a levee bank which runs along the western edge of the Walker Swamp Reserve. So despite everything we have achieved so far, there is still a little more work to do in restoring flow connectivity across the entire reserve.
In follow up posts I’ll start to draw together some of our measurements on flow volumes, to give you a detailed picture of how the wider catchment operates, how this has been influenced by restoration activities and some insights into the amount of water being delivered by the regional drainage networks and how that compares to flows in the Wannon River.